Notion Charts are a great way to make your workspace more engaging, easily visualise data and get powerful insights at a glance. There’s only one problem: Notion doesn’t offer built-in charts just yet. Luckily, there are easy workarounds that allow you to get Charts in Notion regardless of your skill level. Whether you’re a Beginner just looking for a simple Notion Graph or a Data Visualisation Expert, here are the three best ways to add charts to Notion in 2023.
How to add Charts to Notion
Notion currently doesn’t support native charts, but you can use three main workaround to create Notion Charts in the meantime:
- Create Charts in Notion using Notion Embeds
- Create Charts in Notion using Make and Google Sheets
- Create Charts in Notion using Rows
Each method has their own benefits and advantages and which one you should choose will largely depend on your needs and skills.
If you’re a beginner and just want to use charts in Notion to visualise data, then Notion embeds is the way to go.
If you’re more advanced, you can use one of the other two methods. Both allow you to use data in your Notion Workspace to dynamically create and update charts.
Charts in Notion with Notion Embeds
Pro’s
- Super easy to implement
- Wide range of embeds supported
Con’s
- Your Data has to live outside of Notion
- Can’t modify data directly from Notion
When to use: If you don’t need to keep the data itself in Notion and just want to illustrate or visualise data that you process elsewhere anyway, then this is the way to go.
Notion may not have native Notion Charts yet, but luckily they have a different powerful feature that can help us in the meantime: Notion Embeds.
As you might know, you can embed pretty much anything in Notion. Simply copy the link to a website, paste it into Notion, choose the Create embed option and see it come to life. So if your data visualisation tool of choice allows you to share a chart via a link, you can embed it in Notion.
Let’s take a look at how to get a Notion Chart using Causal, an advanced reporting tool that allows you to build complex financial models.
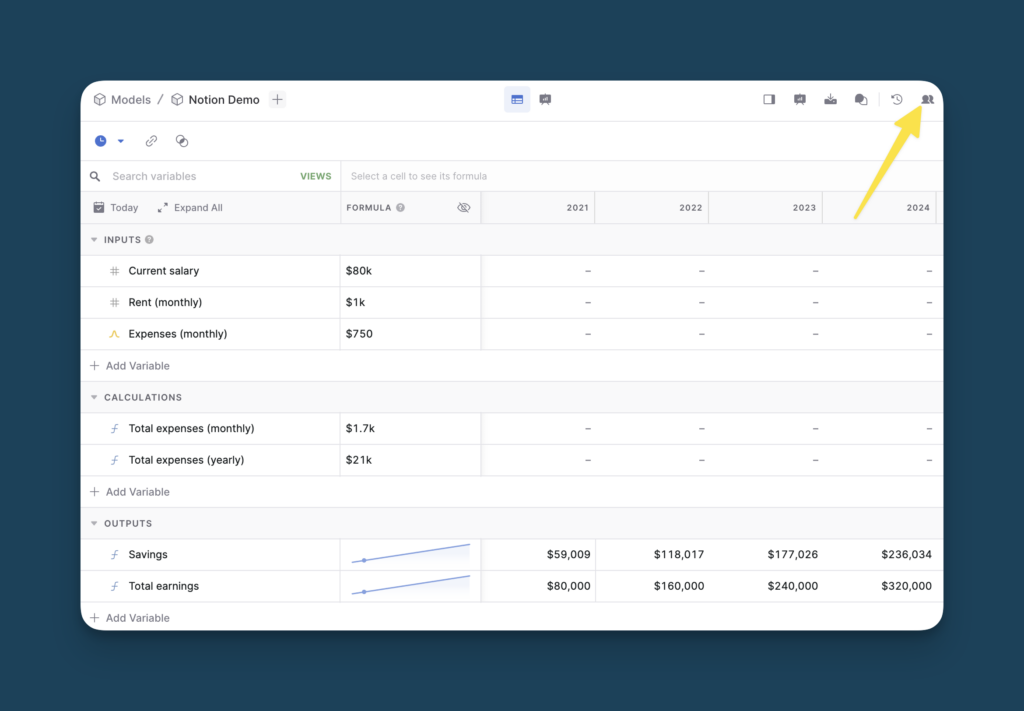
To embed your Causal Chart into Notion, simply click on the Share Icon in the top right corner.
Then, set Share via link to Public and click on Copy code.
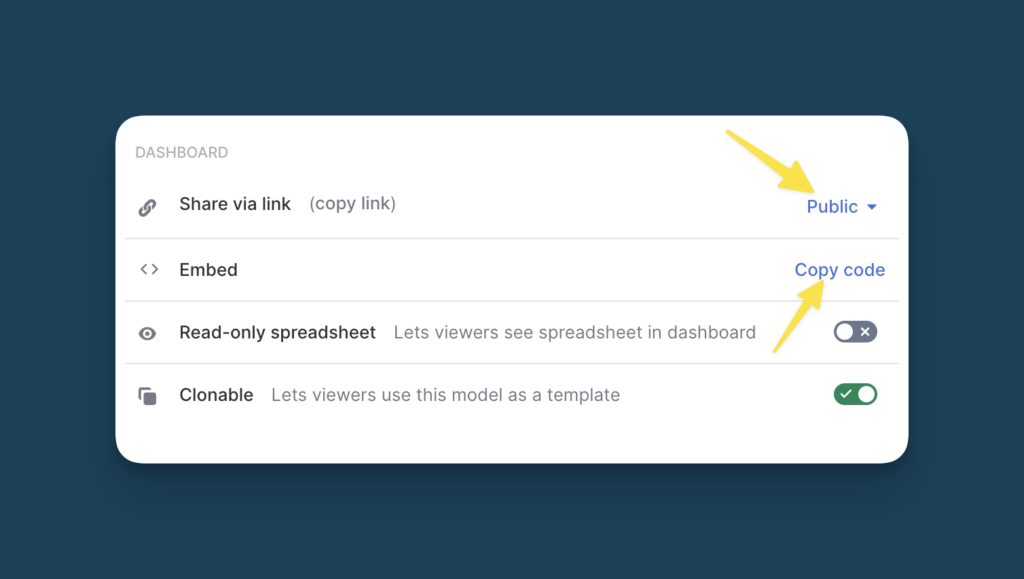
This will give you a so-called iframe embed code that looks a little like this:
<iframe title=”causal” src=”https://my.causal.app/models/153933/embed” width=”100%” height=”600″ frameborder=”0″ allowfullscreen></iframe>
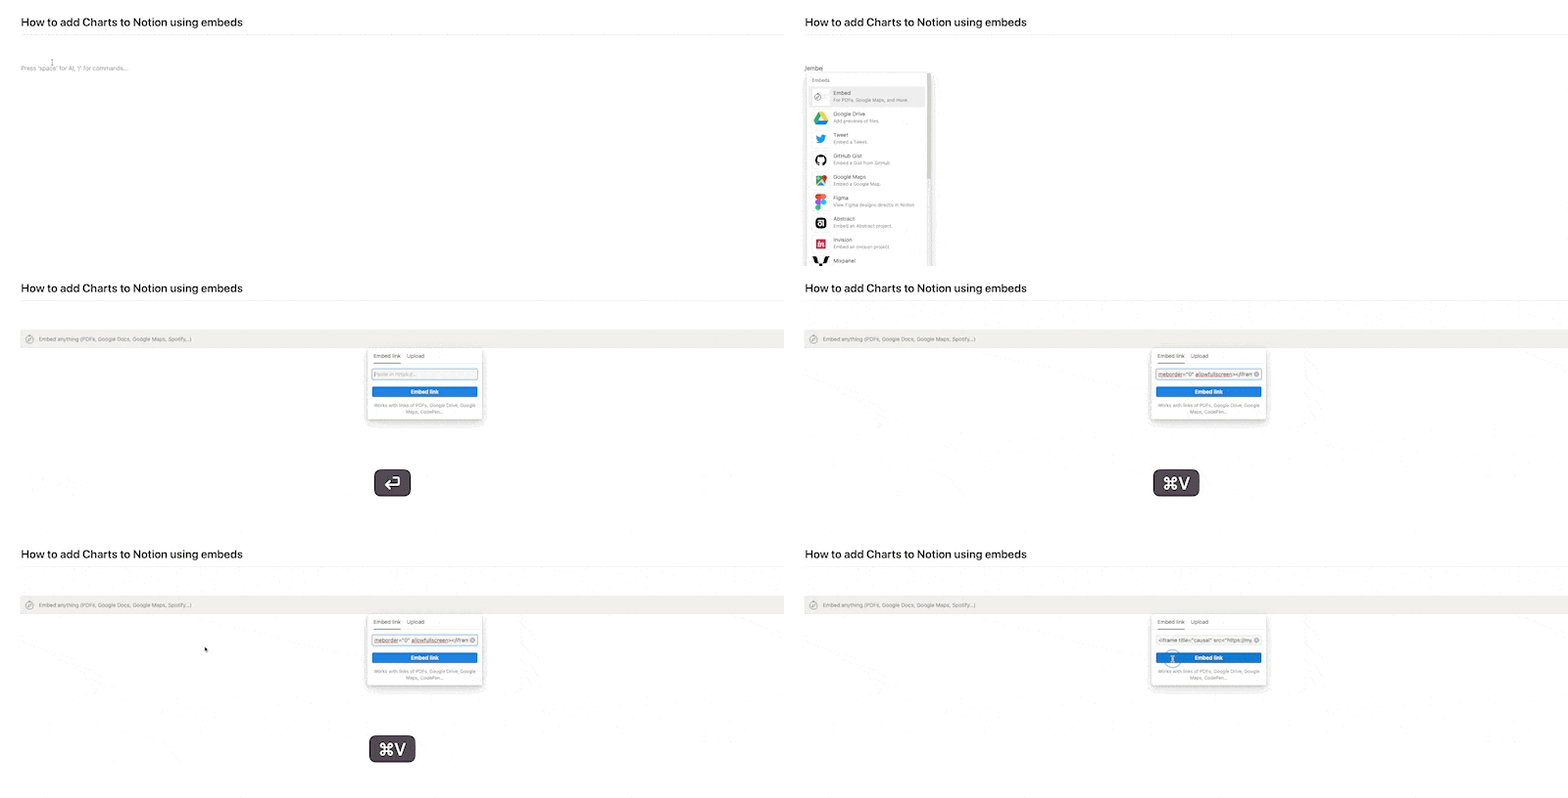
Then, head on over to Notion, type /embed and paste your code into the context box.
Last but not least, adjust the size of your embed and choose your preferred alignment on the page and you’re good to go.
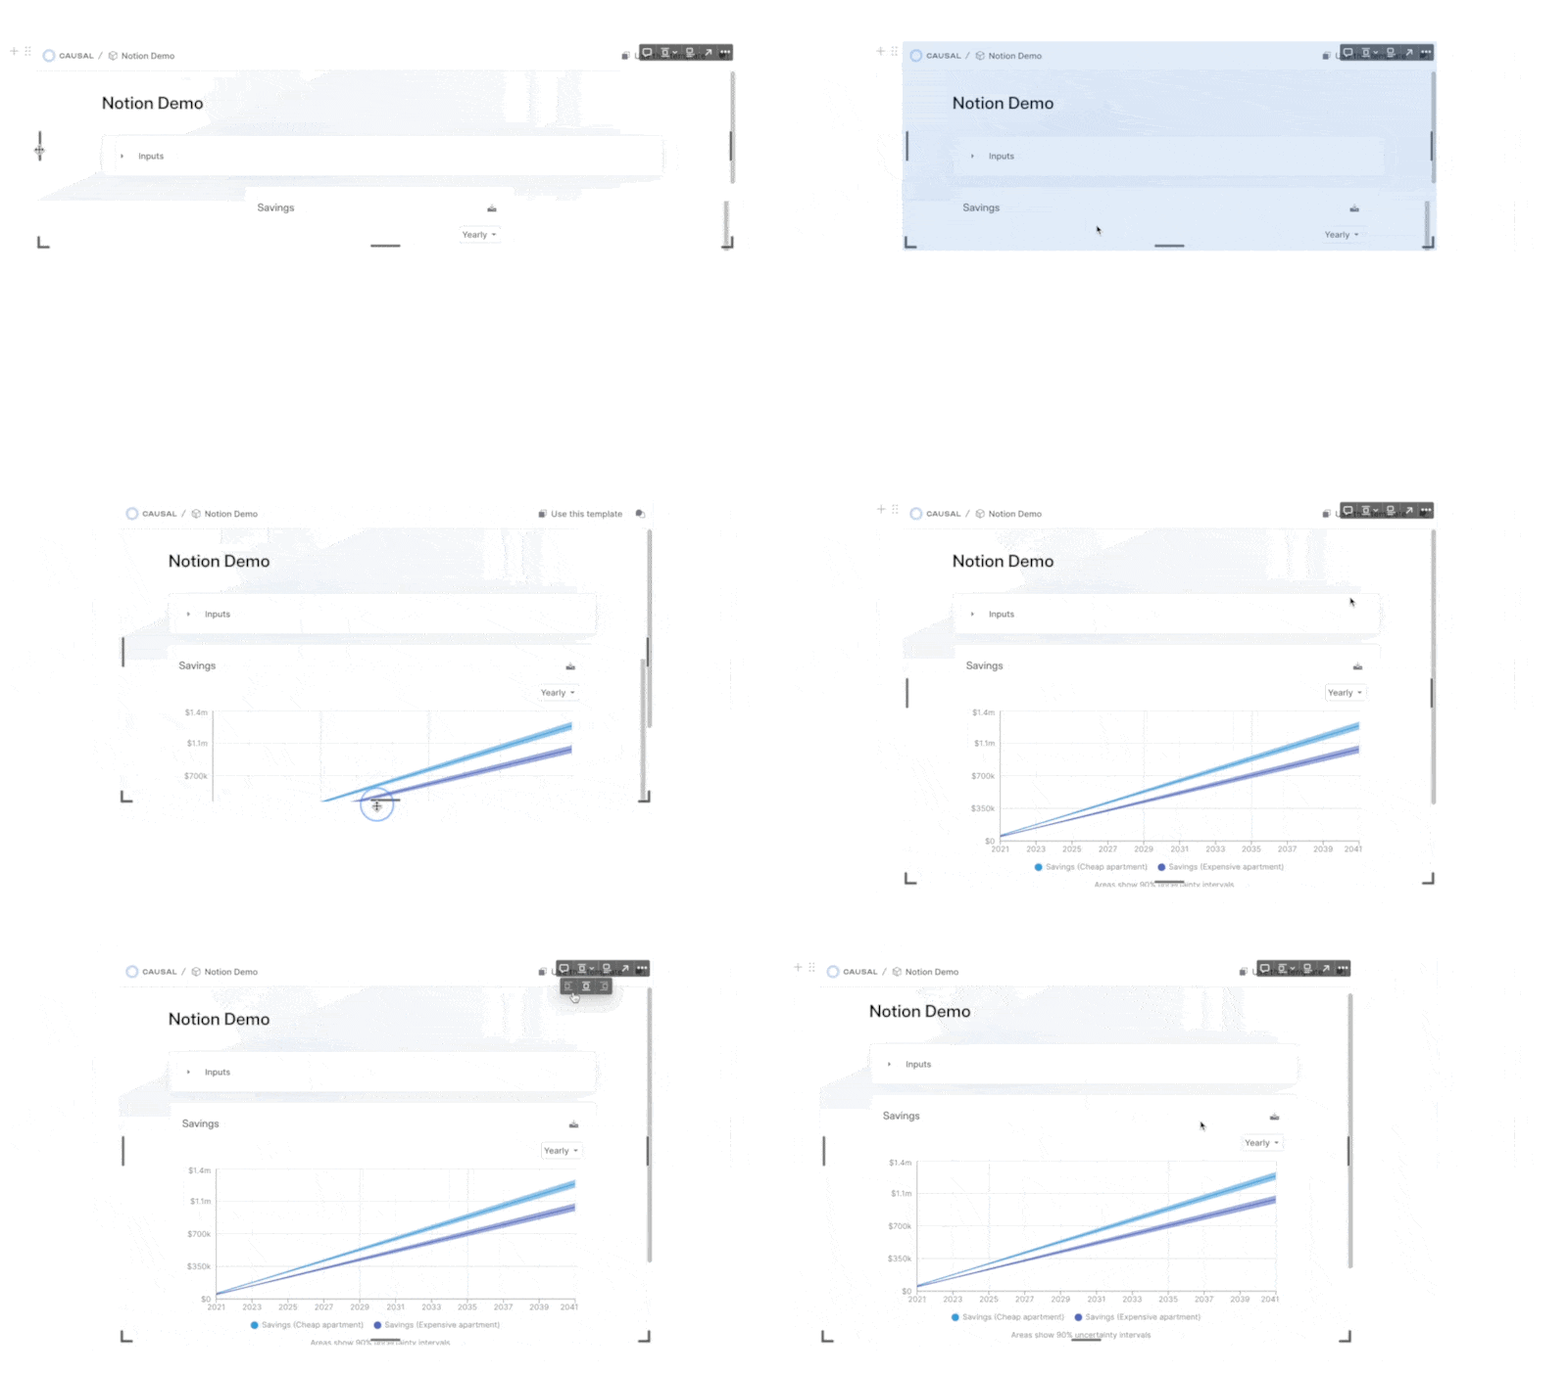
Congratulations! You just created your first of hopefully many Charts in Notion.
Notion Charts with Google Sheets
Pro’s
- Keep your Data in Notion
- Chart in Notion automatically updates
- Free to use
Con’s
- Not suited for complex data
- Google Charts Look isn’t the nicest
- You need to use an intermediary to sync Data
When to use: This method is best for a fairly simple setup, where you continuously add new data points to Notion but don’t need to make complex calculations or need to modify older data.
For a more powerful way to get charts into Notion, look no further than this quick integration with Google Sheets.
In this setup, you can keep your data in Notion and use a no-code automation tool like Make to sync the information to Google Sheets. You can then use Google Sheets to create a chart and re-embed the created chart in Notion.
Even if you never built a no-code automation before, don’t worry. Here are the step-by-step instructions to get you started.
Step 1: Create Your Make Account
First, head on over to Make to create your account.
Make is a no-code automation platform that allows you to connect your favourite apps and streamline your workflows. It’s a super powerful tool and they have a great free plan that’s completely sufficient to build this Notion Charts Automation.
Step 2: Connect Your Notion Database to Make
Next up, it’s time to connect your Notion Database to Make.
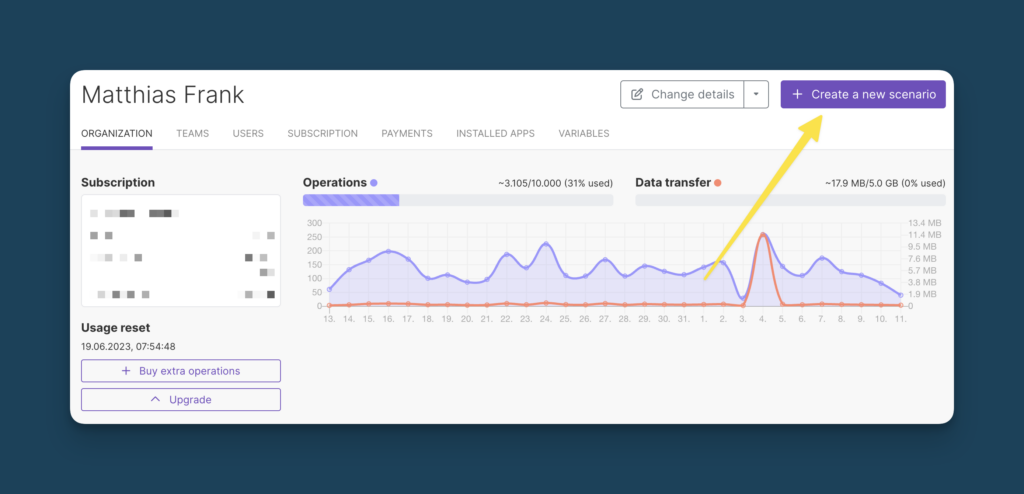
Start by creating a New Scenario in Make. You can do so by clicking the big purple button in the top right corner on your dashboard.
Then, click the big purple plus button, search for Notion and click on the Watch Database Item Module.

Then, click on the Add Button to create the connection to your Notion Workspace and follow the instructions on the screen. Make sure to give Make access to the Notion Page that contains the data for your Notion Charts,
Step 3: Build Your Automation
With the connection established, it’s time to build out the automation.
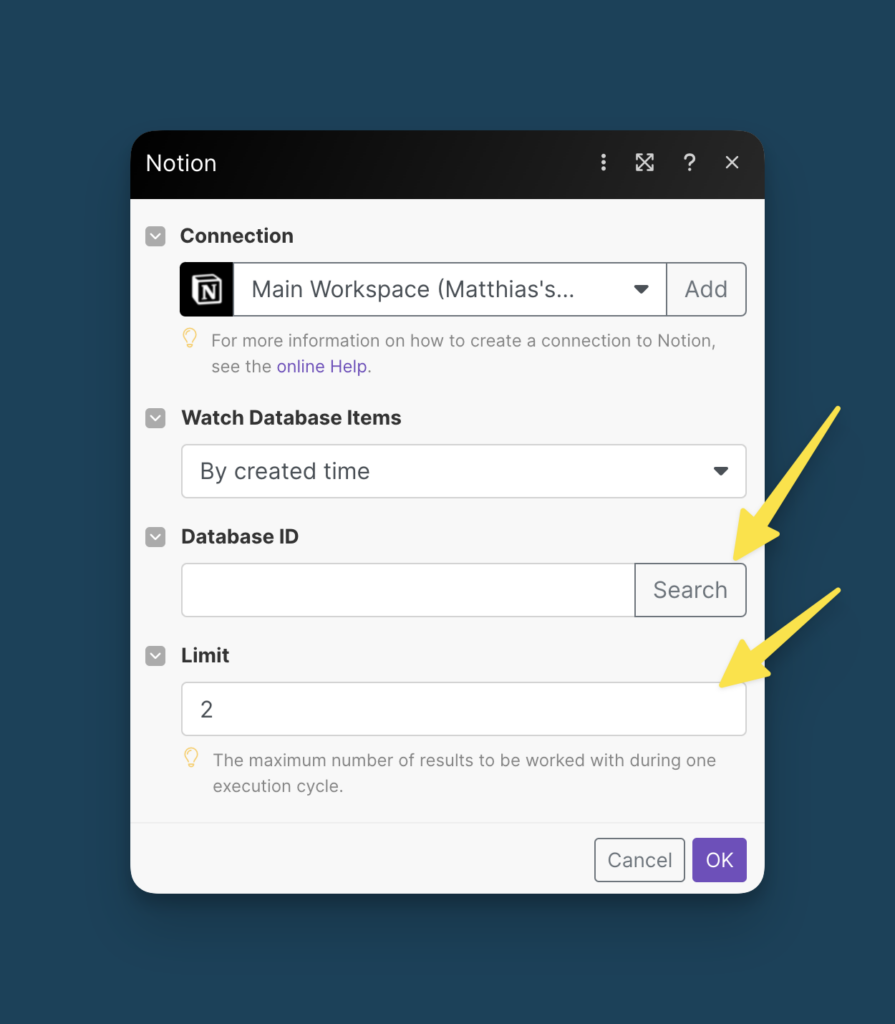
- Click the Search button and type in the name of the database in Notion that contains the information for your Notion Chart
- Then, set the Limit for the automation. It should be high enough to process all new data entries that you make between to automation cycles.
Example: if you want to run the automation once a day and you usually add 3 entries to your Notion Database in that timeframe, set the limit to 4 or 5 (for some buffer).
Then, close the context menu and test the connection. To do so, click the Run once button in the bottom left of your screen (make sure to have some sample data in your database).
Click on the magnifying glass icon that pops up to inspect the information. You should see at least one bundle of information.
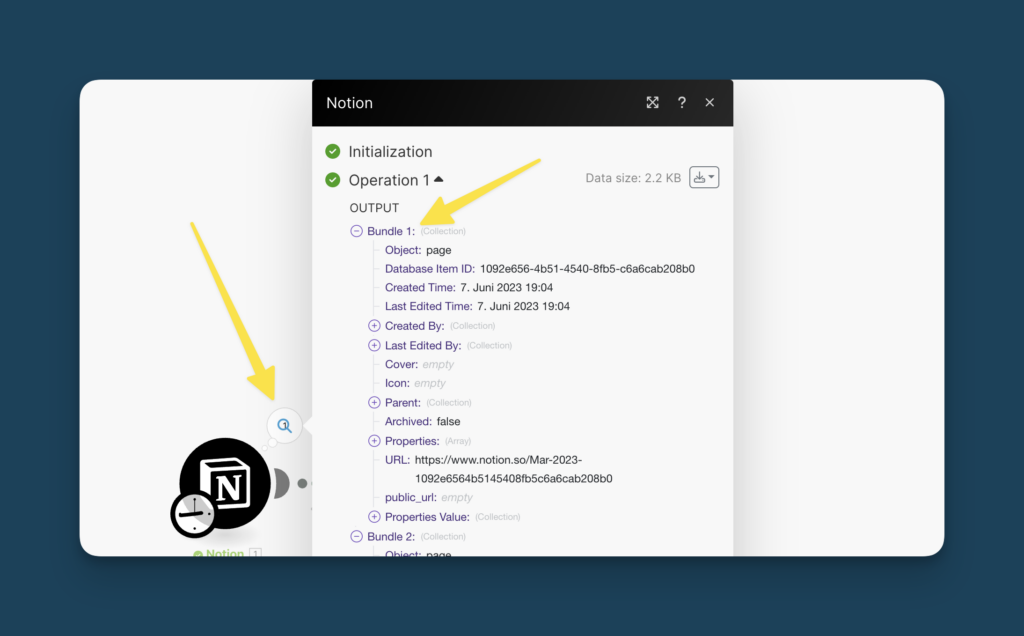
Now, click on the Add another module option on the right side of your first module. Search for Google Sheets and opt for the Add a row module.
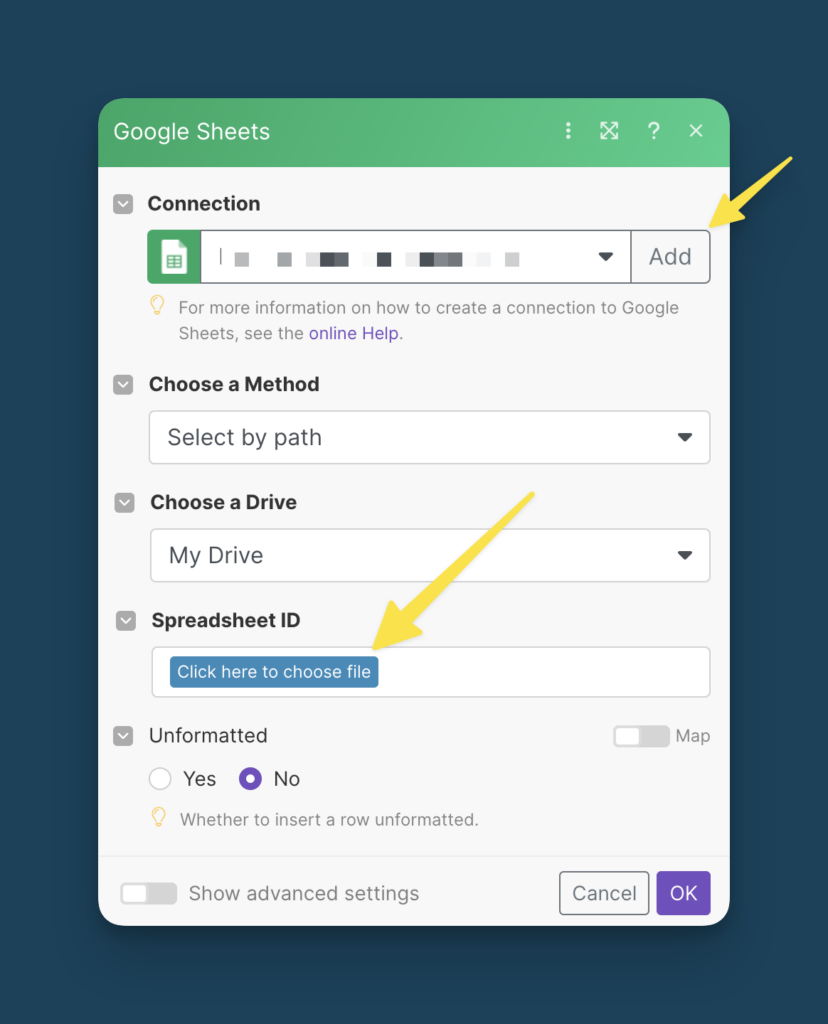
Just like with Notion before, click on Add to establish a connection to your Google Account. Then, select the Google Sheet where you want to create your Notion Charts.
Make will automatically pull in your columns from the spreadsheet.
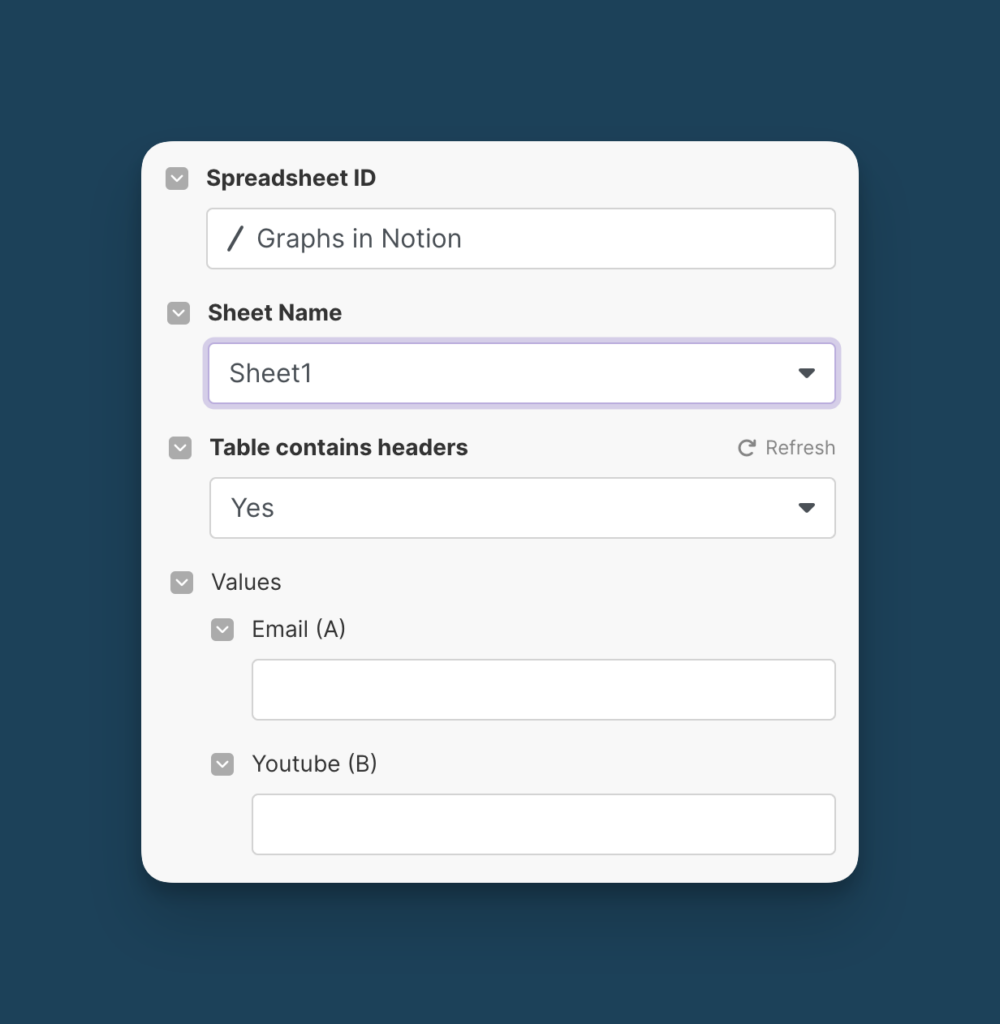
To finish the setup, click into each column field and select the information from Notion that should be exported to Google Sheets.
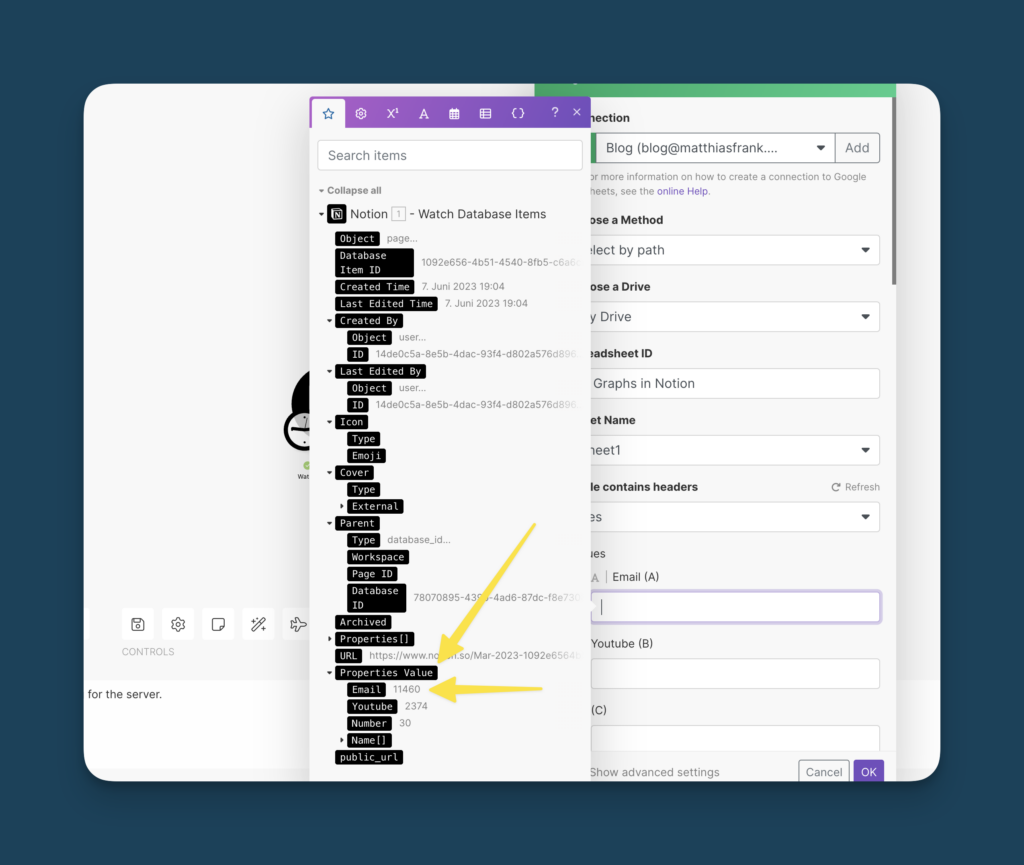
The relevant information is hidden inside the Properties Values toggle.
Once you’re done, click the Run once button again to test that the information is actually added to Google Sheets (you’ll need to add new datapoints to the Notion database first).
Step 4: Embed Google Sheets Chart in Notion
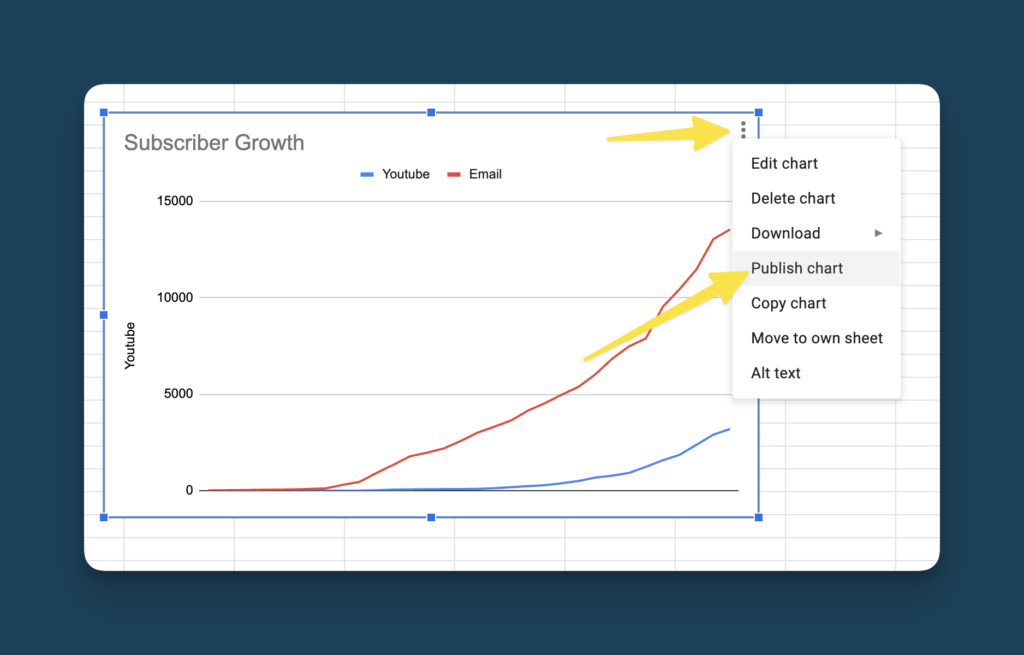
Back in Google Sheets, use the freshly imported data from Notion to create any chart you want. In this example, I built a line chart out of my subscriber data. Then, click on the three dots in the top right corner and select Publish Chart
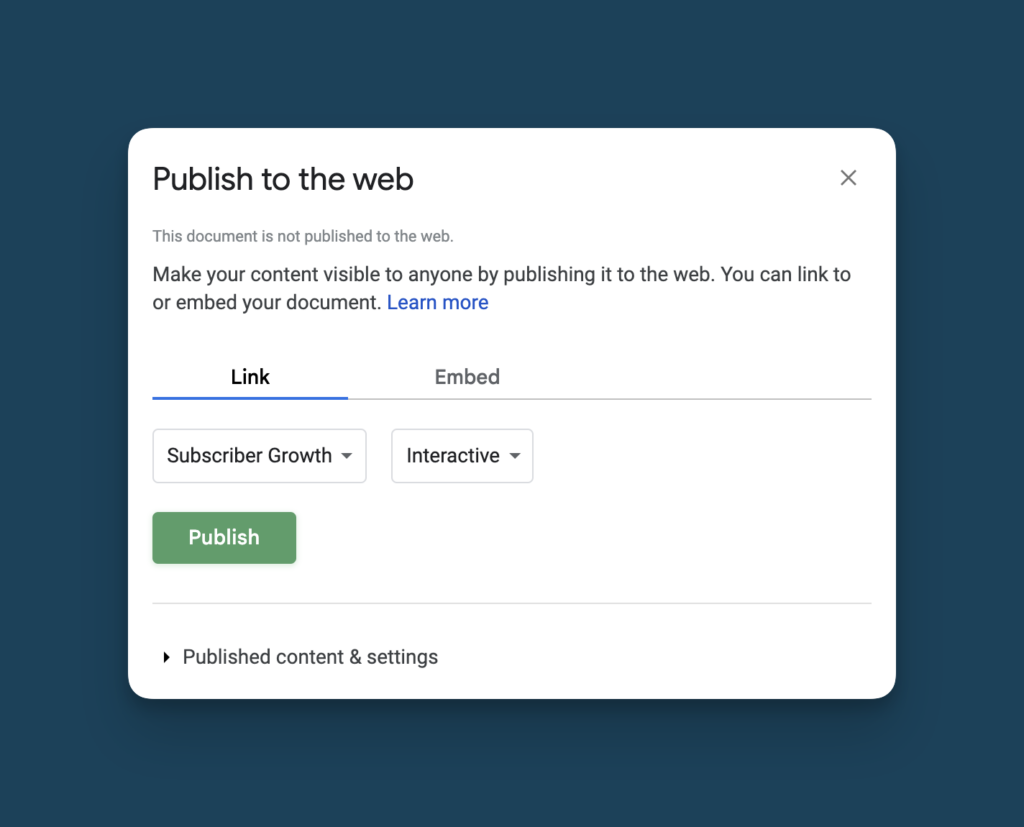
Use the Link option and click on Publish
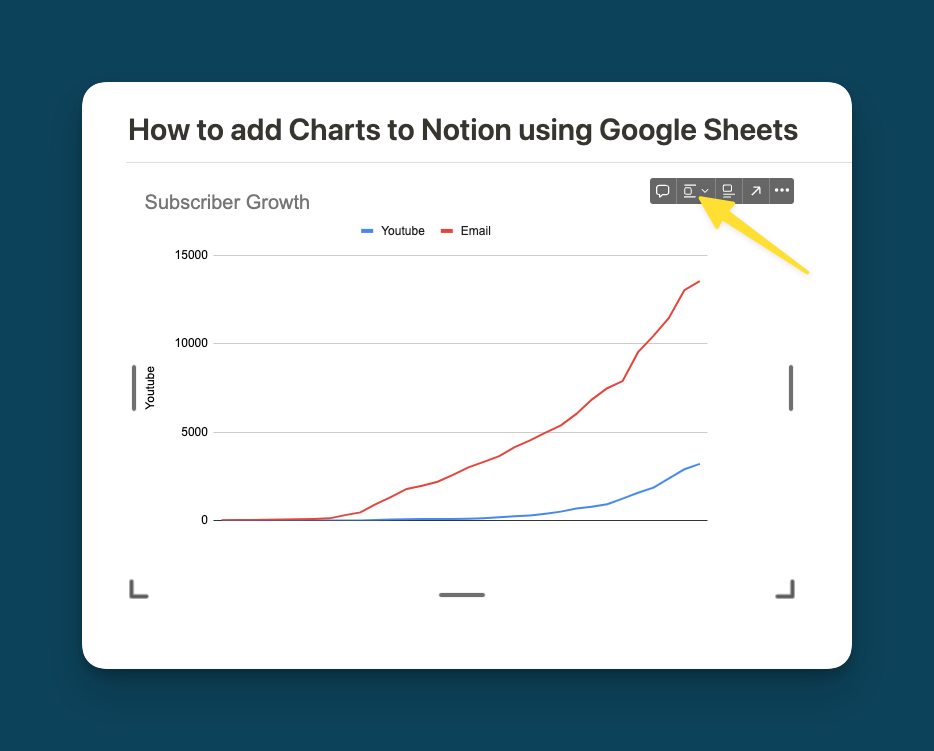
Head over to Notion, type /embed and paste the link. Then, adjust the size of the embed and the alignment and you’re good to go!
Tip: The published Google Sheet Chart has a slight delay when it comes to updating. Give it a few minutes after you made changes to your data.
Step 5: Schedule your automation
Last but not least, schedule your automation to ensure that data is automatically synced from your Notion Database to your Google Sheet.
- Click on Every 15 Minutes to select the frequency for your updates
- Then, click on the Save icon to the right of it to save the whole setup
- Finish by clicking on the Scheduling button on the left
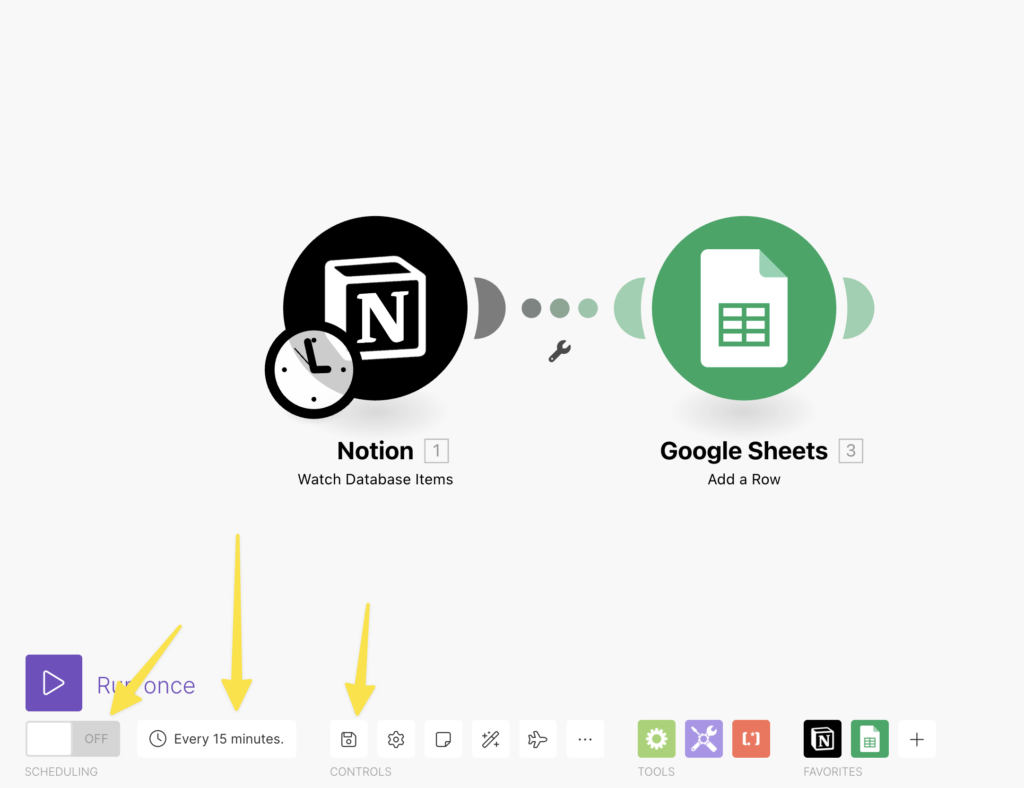
And that’s it! You now have a Notion Chart based on the data in your Notion Database and it will automatically update whenever you add a new entry.
Notion Charts with Rows
Pro
- Allows for complex modelling
- Automatic Data Updates
- Keep all your Data in Notion
- Free to use
Cons
- Most complex setup
When to use: The Rows + Notion Combo is perfect if you have a more complex data situation or just want the most customisable way to get Charts in Notion
Rows is a really cool spreadsheet tool that allows you to build the most powerful and customisable Charts in Notion.
The general setup process is similar to the Google Sheets Method. You can add your data to Notion, sync it to Rows, manipulate and modify it like in any spreadsheet tool and then create embeddable charts.
The big difference that makes this method a lot more powerful? Rows can process API calls inside the spreadsheet, so you don’t need a third-party tool like Make to sync the data.
That means it’s much easier to work with data that changes frequently. It’s also a more stable setup for further data manipulation. As a spreadsheet, Rows allows for plenty of ways to analyse and prepare your Notion Data before turning it into Notion Charts.
The initial setup is a bit complicated, but it’s definitely worth it. Here’s how you can use Rows to get Charts in Notion
Step 1: Get Your Notion API Key
If you want to create Notion Charts with Rows, you first need to get your Notion API Key.
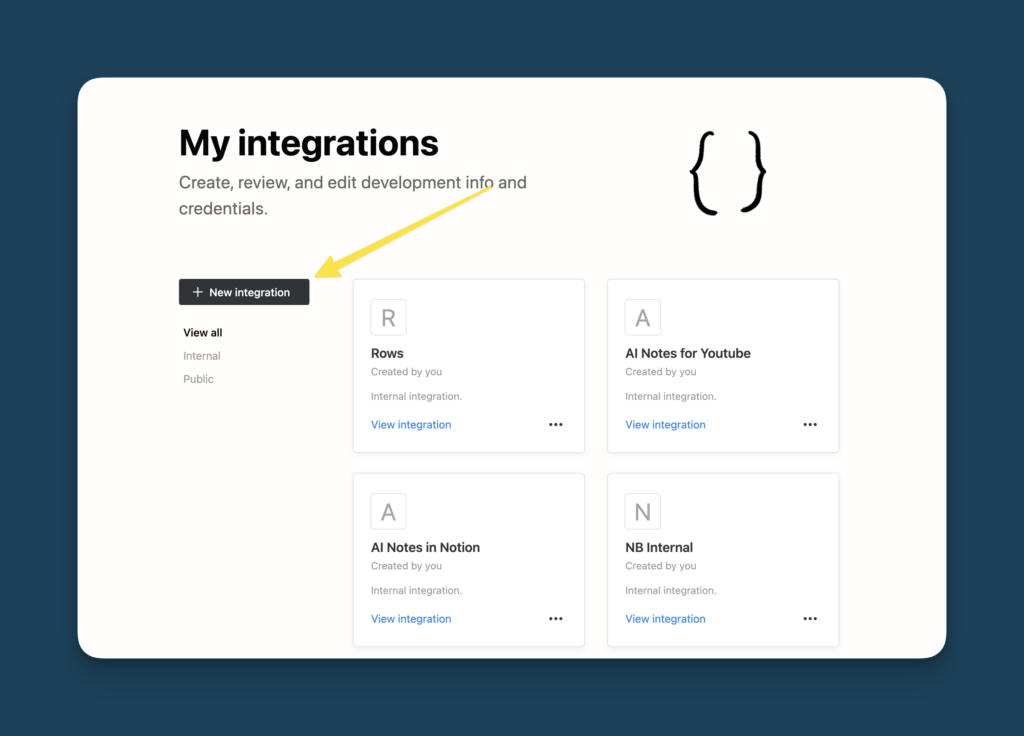
Doing so is simple. Head on over to https://notion.so/my-integrations/ and click on New integration.
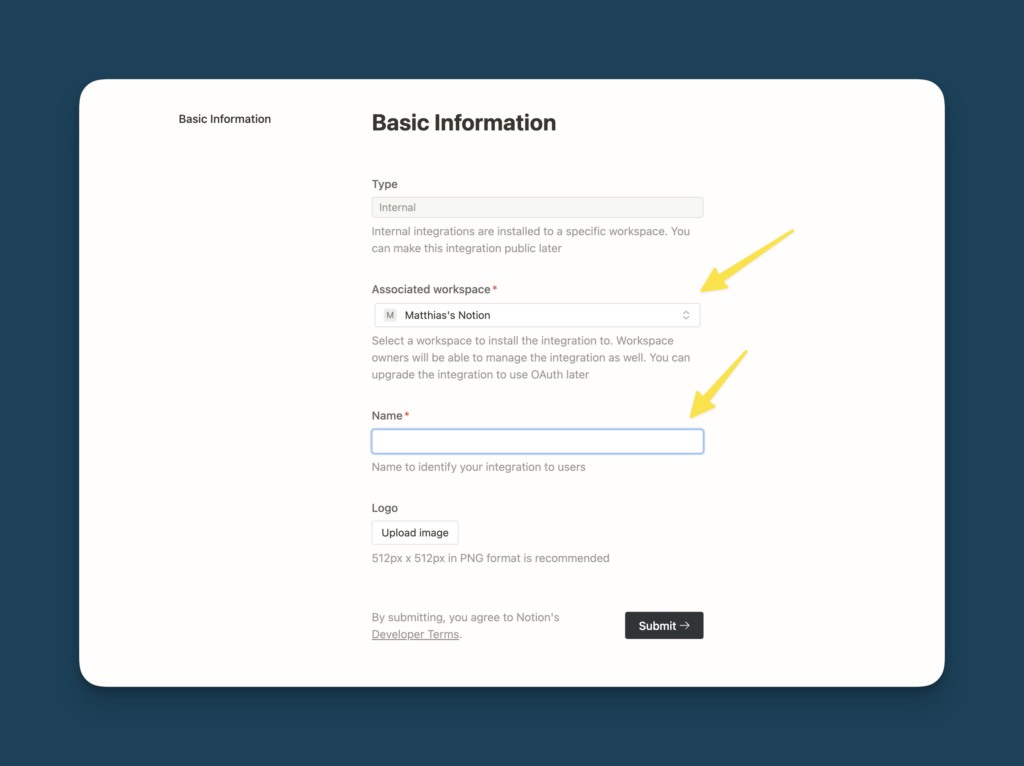
Make sure you select the correct workspace and give your integration a name. Then, hit submit to create the integration.
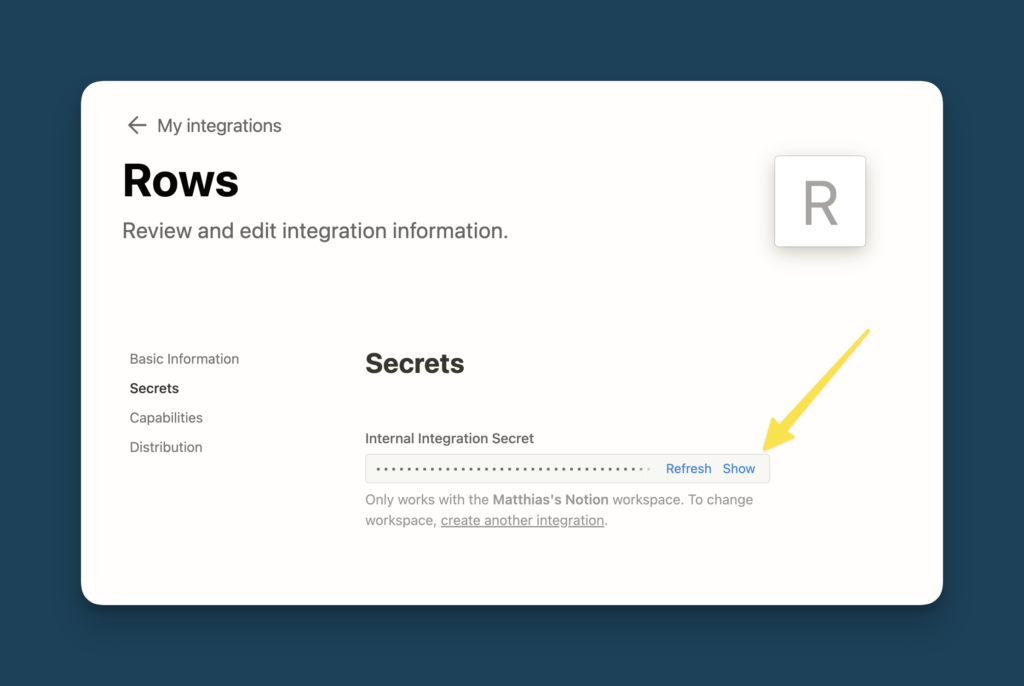
Then, click on Show and then on Copy to grab your Notion API Key. Save it in a secure location.
Last but not least, give your integration access to the relevant data in Notion. To do so, navigate to the Notion Page that contains the data for your Notion Charts and click on the three dots in the top right corner. Then, navigate down to Add connections and select the integration you just created
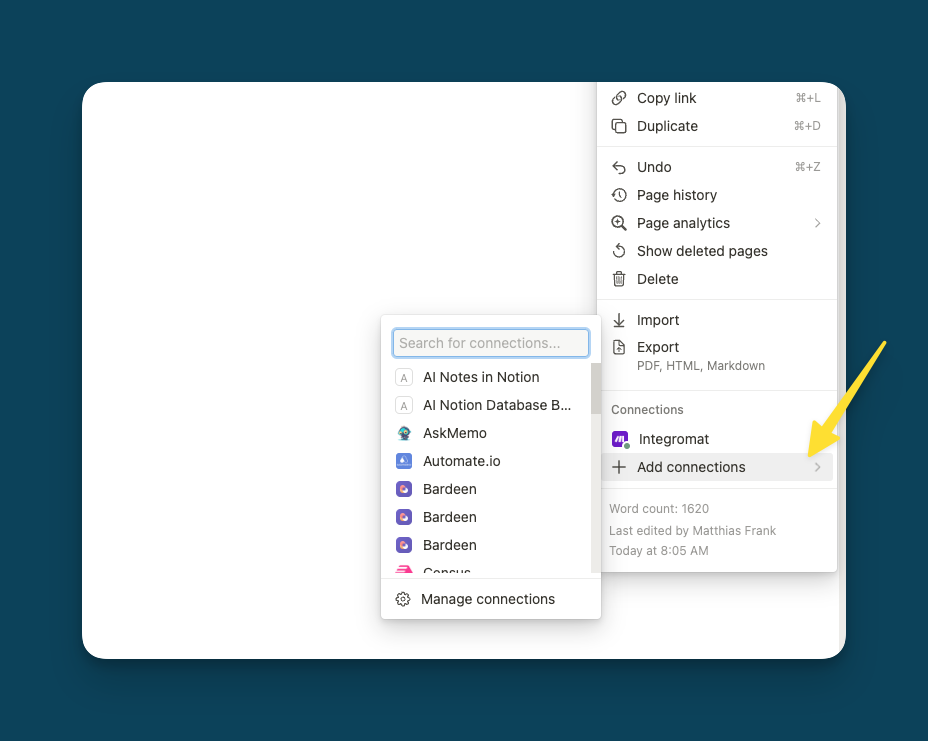
Tip: Notion sometimes takes a moment to register a new integration. If yours doesn’t show up, try refreshing Notion if you use it in your browser or close and restart the app.
Step 2: Connect Rows to Notion via API
Now it’s time to connect Rows to Notion and sync your Notion Data into the Rows Spreadsheet.
If the following setup looks complicated, don’t worry. You can always download the free template at the bottom of this page that has everything you need to start immediately.
Head on over to Rows and create your account. Then, create a new spreadsheet.
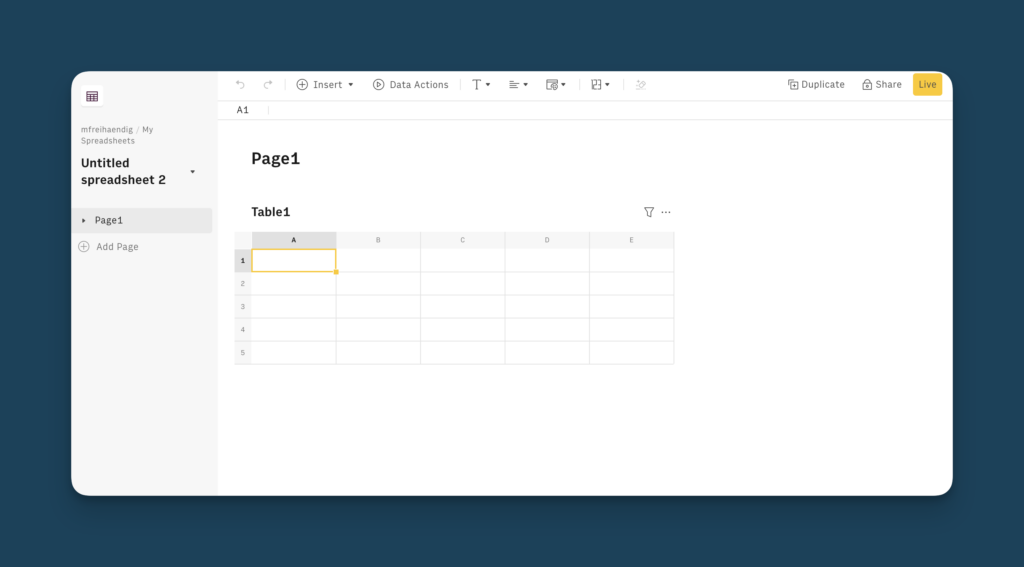
As mentioned previously, Rows is special and allows you to perform API calls right from a spreadsheet cell. You could write the whole API call into one cell, but it will be much easier if we spread it out a bit.
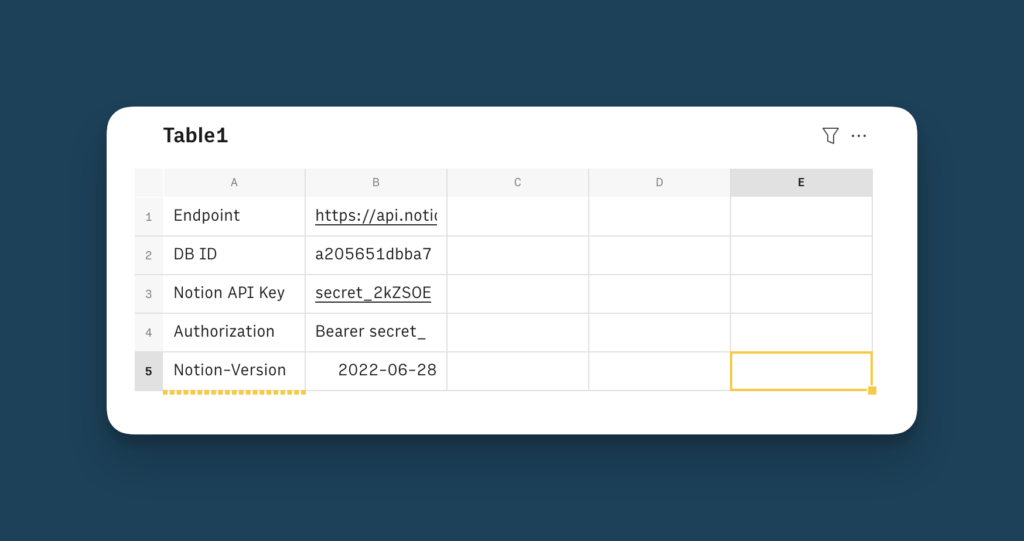
Start by typing Endpoint into A1 and then copy the following formula into the corresponding B1 cell:
=concat(concat(“https://api.notion.com/v1/databases/”,B2),”/query“)
This formula will dynamically build the correct URL for the API call based on the database ID that you enter in B2.
Speaking of B2, type DB ID into A2 and then paste the ID for the database that contains your Notion data into B2.
To find your Notion Database ID, follow these steps:
- Open your database as a full page
- Copy the link to the page
- Paste the link into your browser or a text editor to inspect it
- Find the string between your workspace name and the first ?

Next, type Notion API Key into A3 and then paste your API key into B3.
A4 should say Authorization and B4 should contain this formula:
=CONCATENATE(“Bearer”,” “,B3)
Last but not least, type Notion-Version into A5 and 2022-06-28 into B5.
Here’s how your setup should look like:
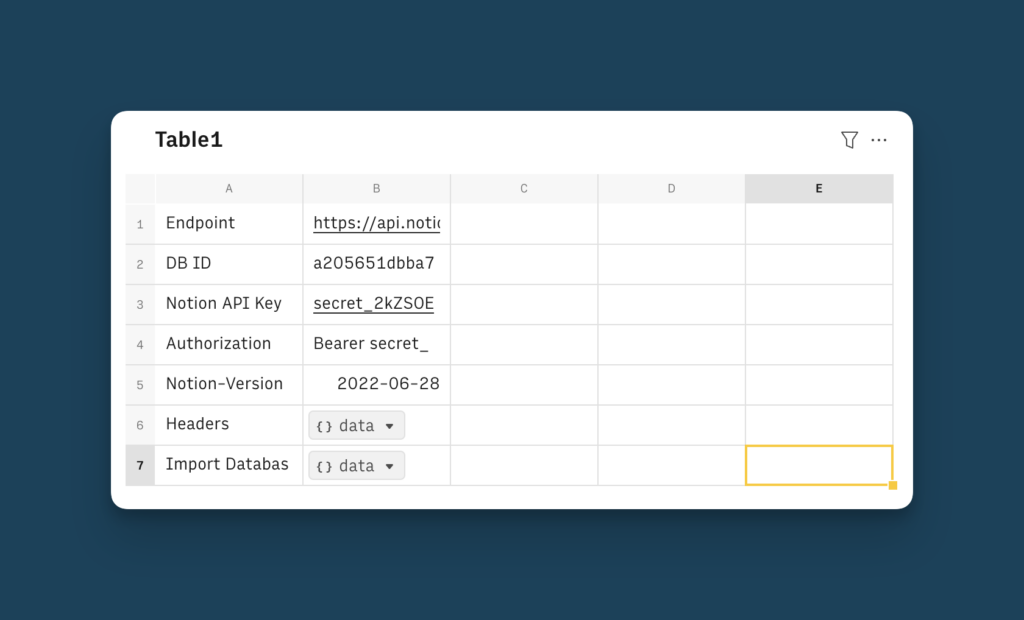
Now, continue in A6 and type Headers. Into B6, paste this:
=PAIR2JSON(A4,B4,A5,B5)
The actual API call from Rows to Notion will happen in the next line. A7 should read Import Database and B7 should have this formula:
=POST(B1,B6,”{}”)
This formula takes all your previous information and sends an API call to Notion to retrieve the information from the database that you list in B2.
Step 3: Work with Notion Data in Rows
With your Notion Data imported in Rows, you can easily start working with it – just like in any spreadsheet.
To start, click on the data cell in B7 and select Inspect Data. This opens up a side window showing you all the information that the API call brought into Rows.
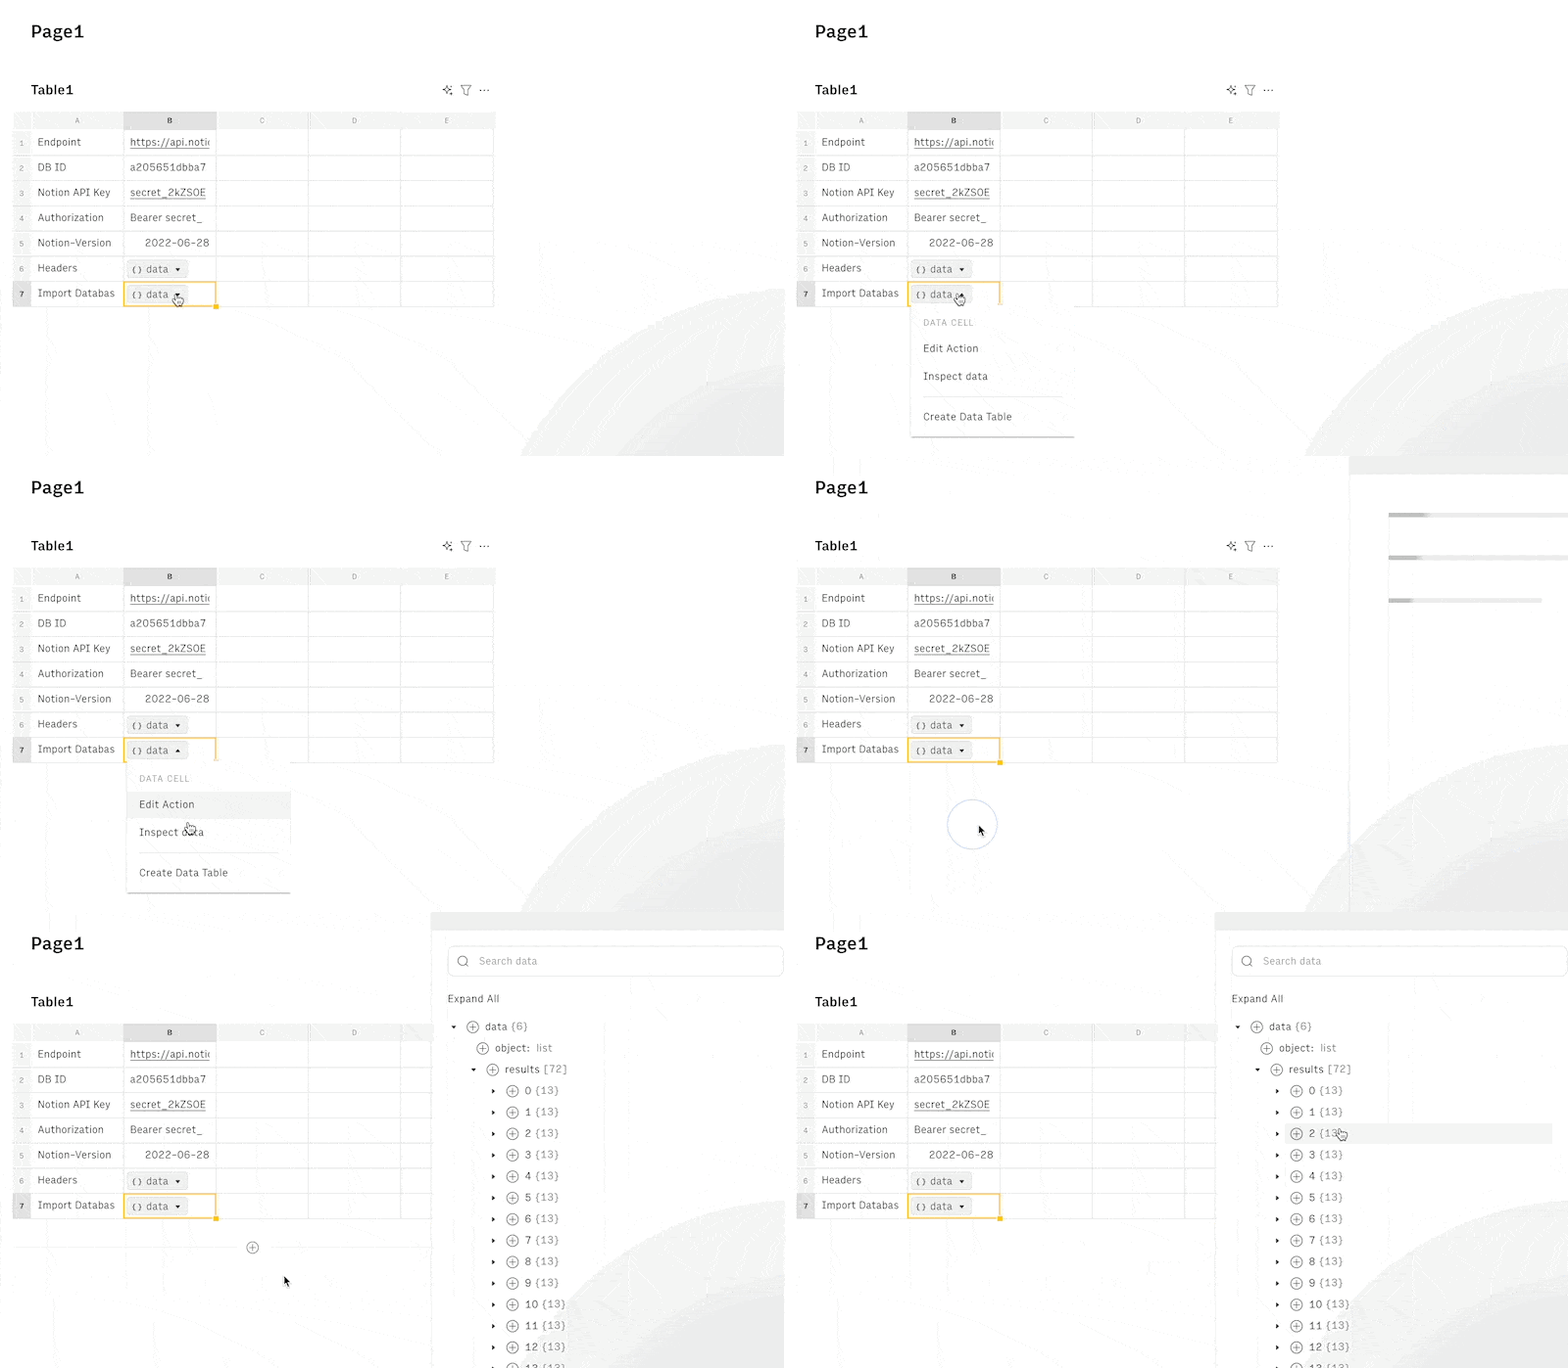
Since we only really care about the information inside results, we make our live a bit easier and extract that bit before we move on to the next step. You can parse JSON directly in rows with the PARSE command.
To do so, create a new row by clicking into A7 and hitting enter. Then, type Results into A8 and add the following formula to B8:
=PARSE(B7,”[‘results’]”)
If you inspect the new data in B8, you’ll see that it now only contains the results (i.e. the values for the entries in your Notion database).
Time to make the data a bit more usable. Click on the data cell in B8, select Create Data Table and confirm with Next Step in the confirmation window.
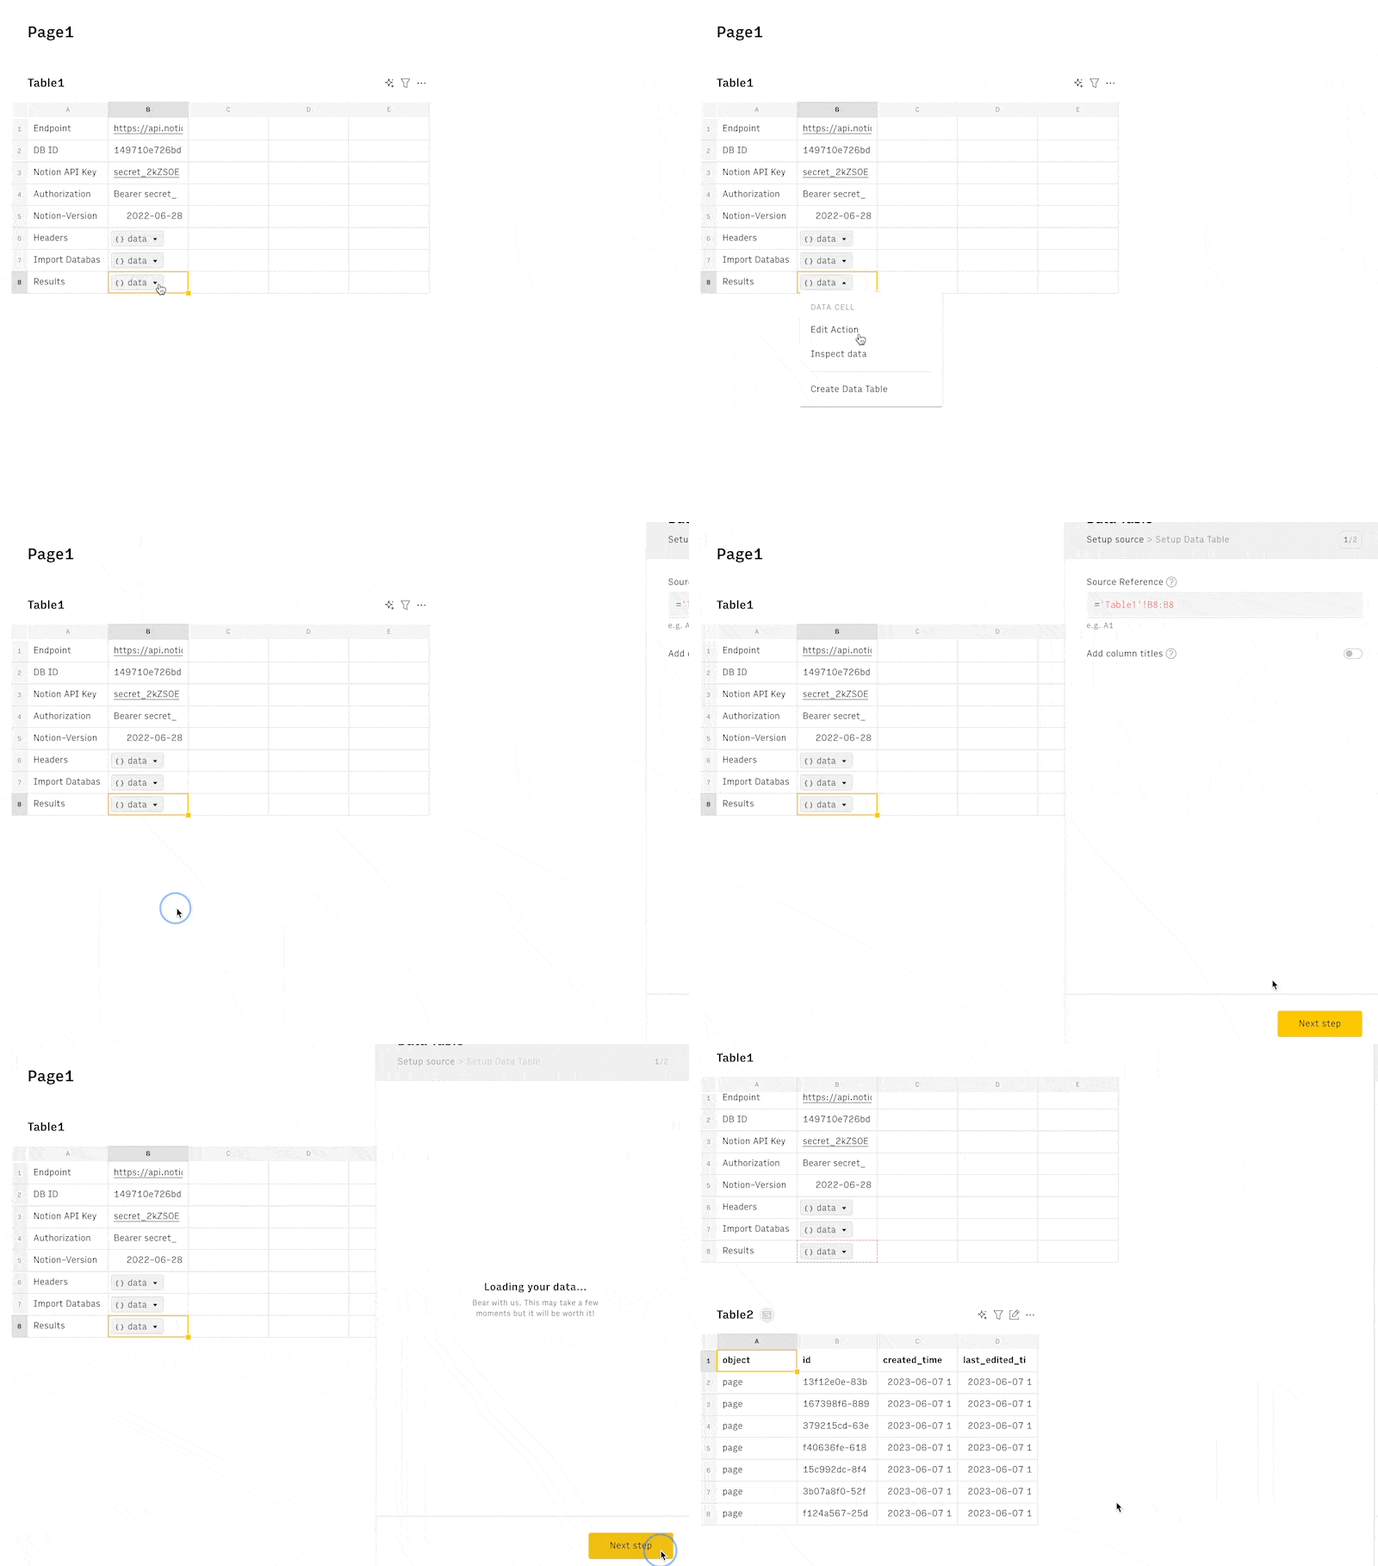
Rows will automatically create another spreadsheet with the data from Notion. This table is synced with the data in B8, so if you change anything in Notion and refresh the formula from the API call in B7, it will automatically show the new data.
Tip: You can automatically refresh the data to continuously pull changes from Notion into Rows. For more details, see Step 5.
However, the default data in this table isn’t the one we actually care about. Luckily, we can modify what Rows shows us by clicking the little edit icon above the table.
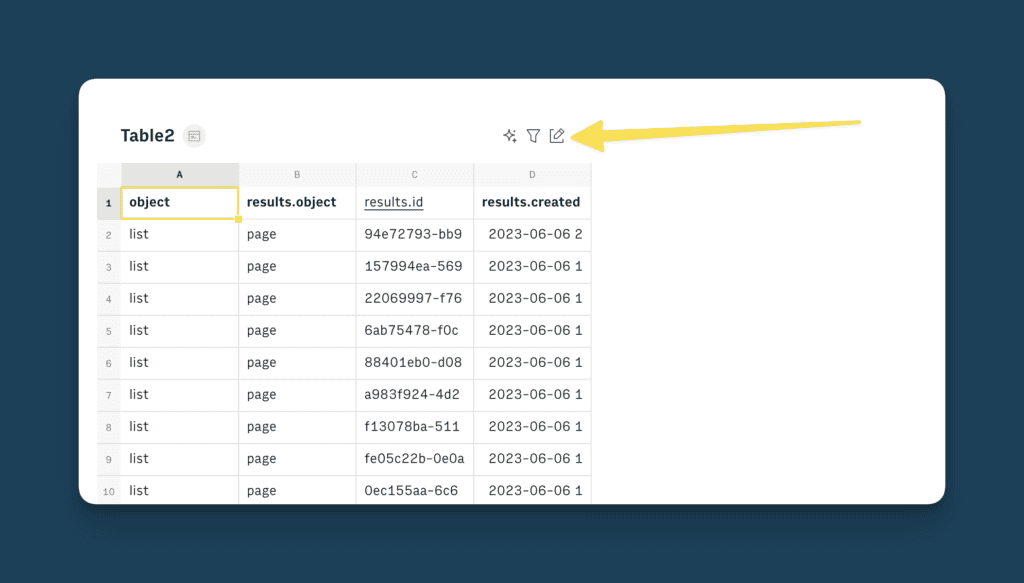
In the context menu that appears, go to the Table columns, remove the entries, click on the dropdown and navigate to properties. In here, you’ll see a list of all the properties from your database.
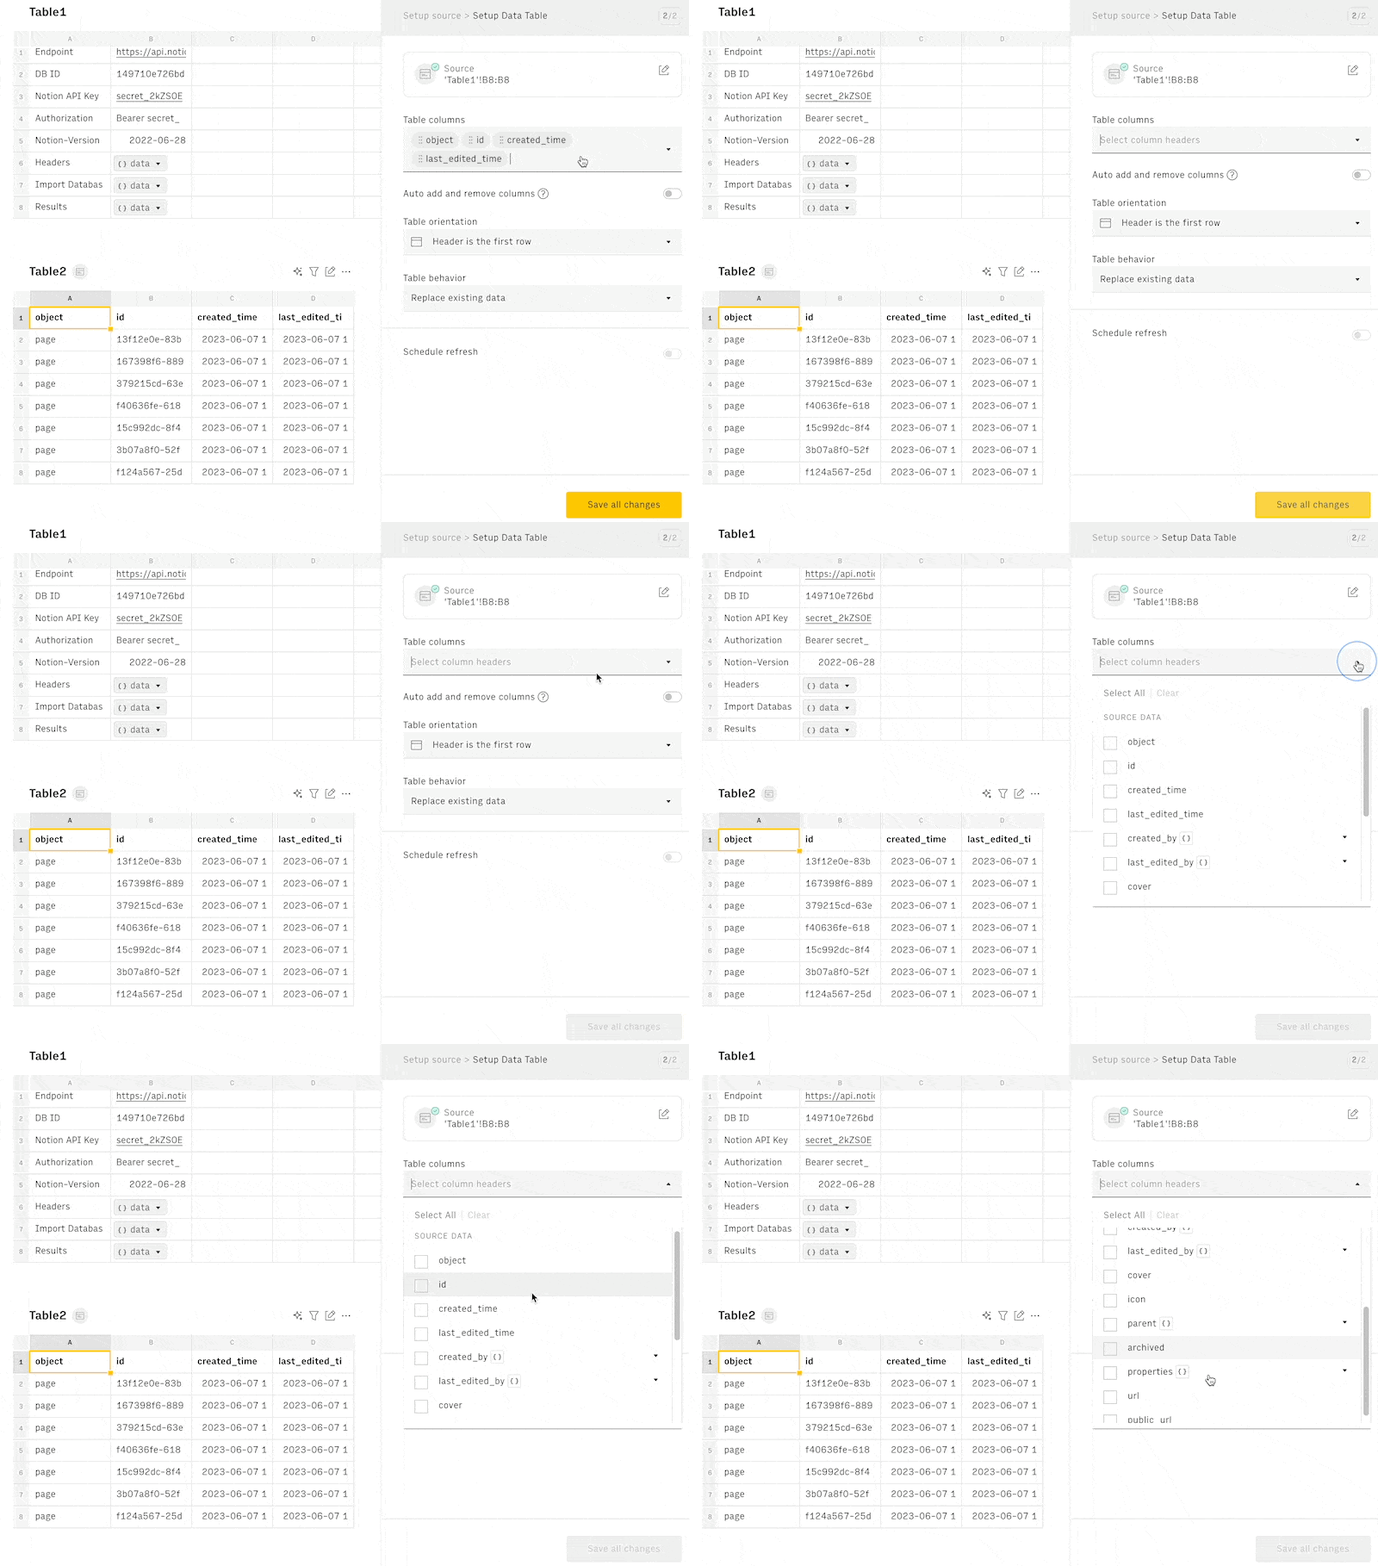
Make sure to expand the individual properties again and tick the checkbox next to the actual value. For number properties, that’s number.
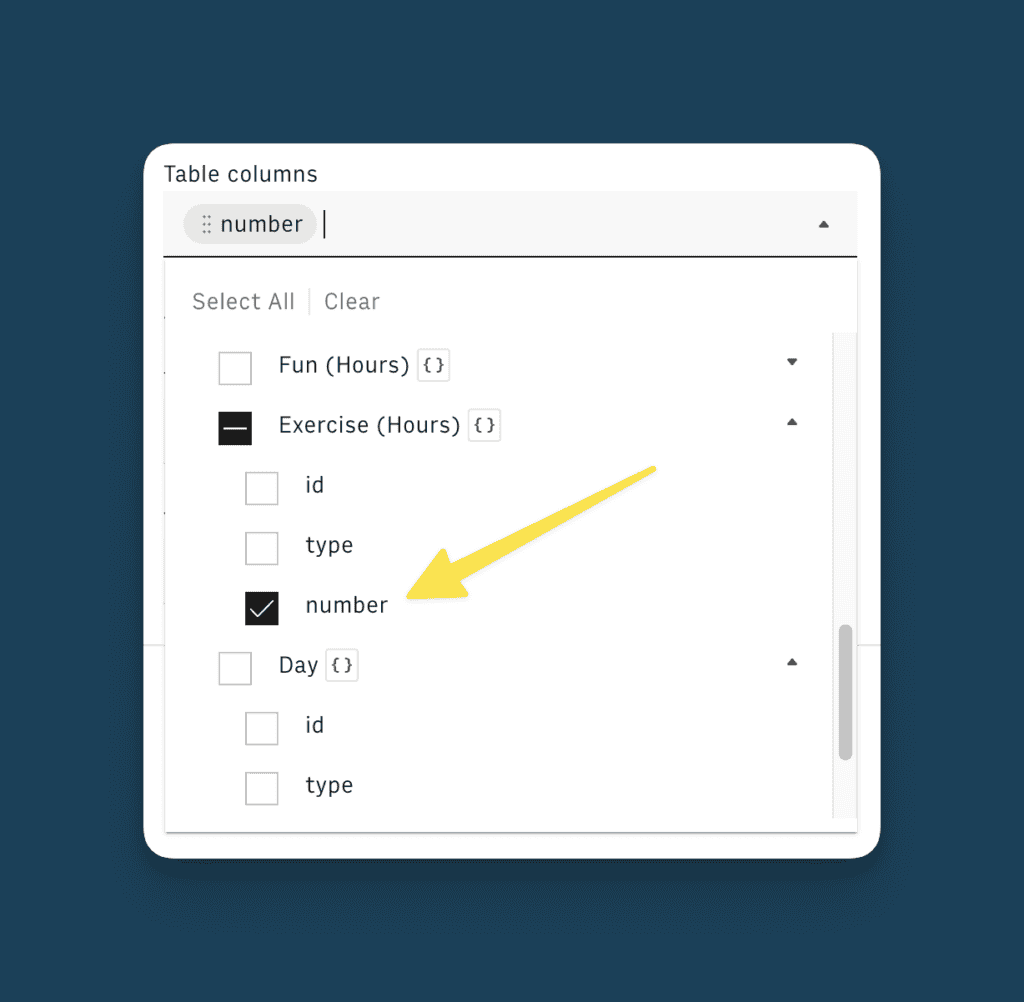
For a text property like the title, it’s the plain_text, which is nested one further level down (inside title or rich_text)
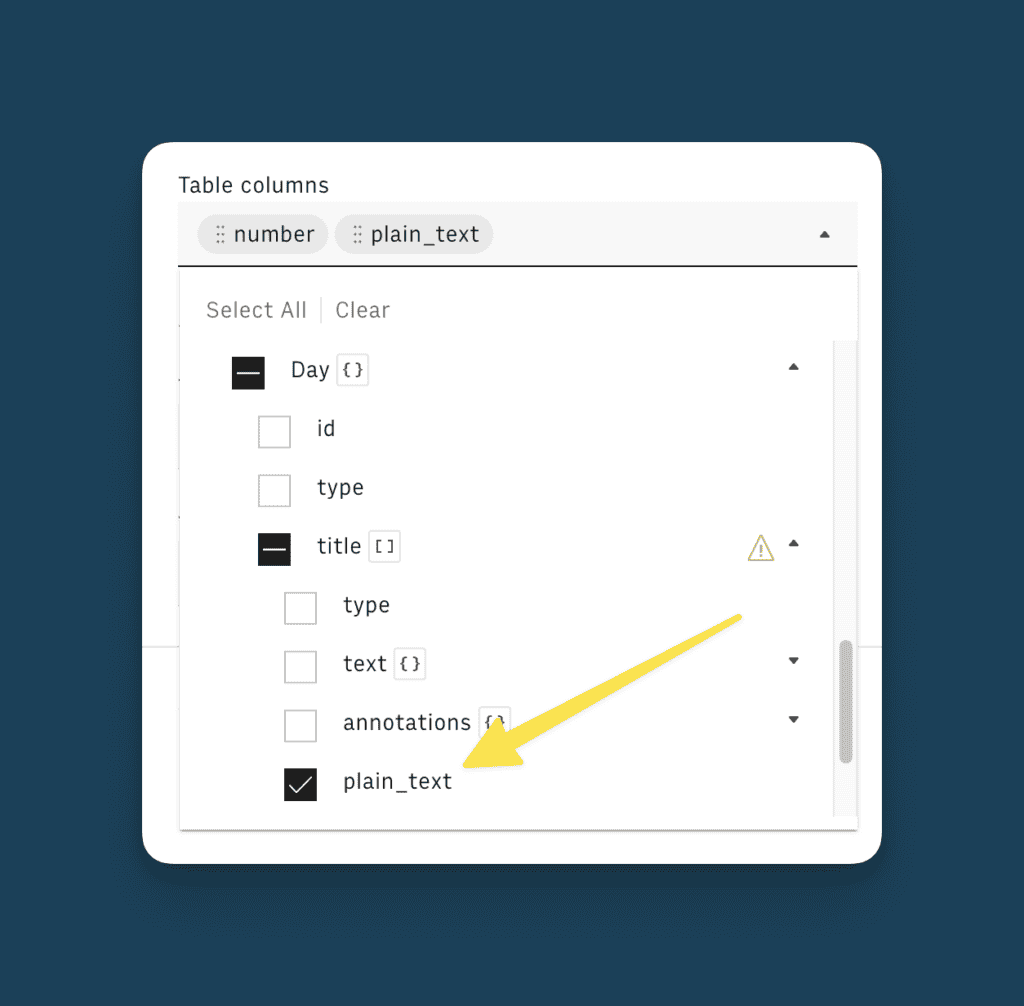
Select all the values that you want to see in your table and hit Save all changes. Your table will reload with the new entries. The column names are a bit off, but you can click into them and rename them.
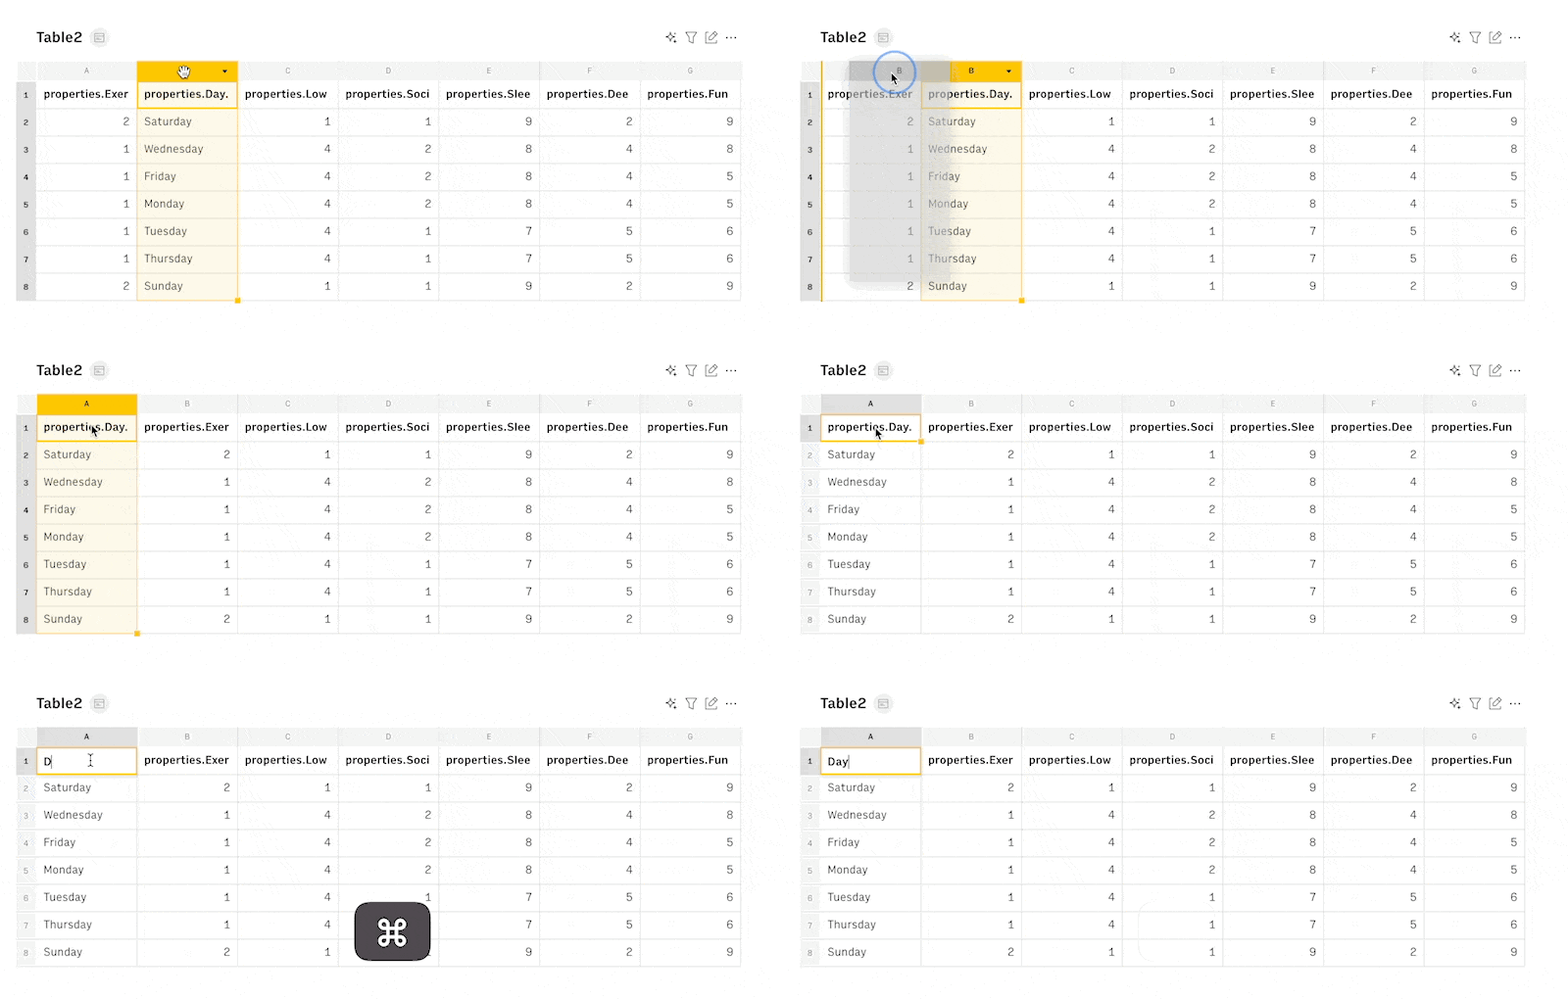
You can manually re-arrange rows by dragging them or you can highlight the first row and click on the filter icon in the top right corner of the table to turn on sorting and filtering.
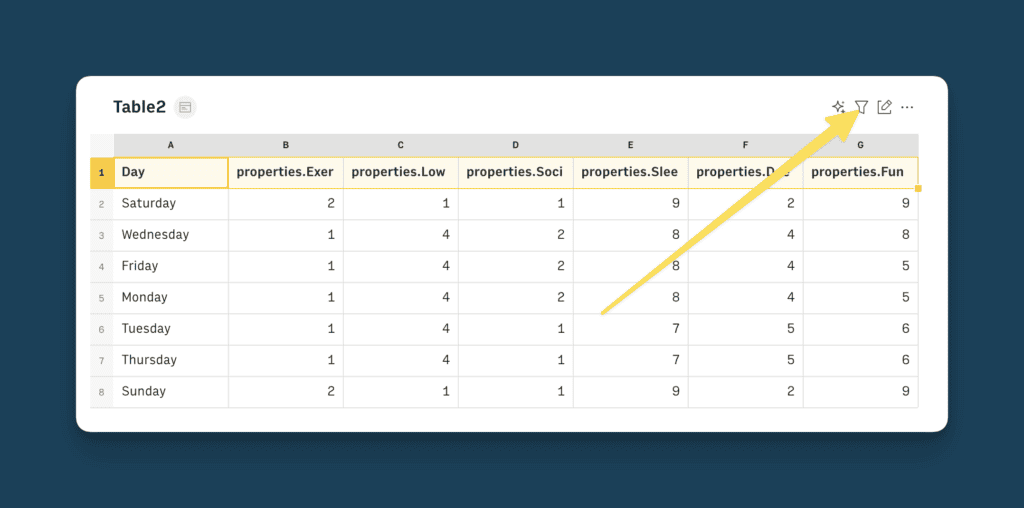
You can also add more data or calculations to the chart. If you want to calculate the total values for example, just add a row below and use the SUM formula like you would in any other spreadsheet tool.
With your data ready, it’s time to create your chart. To do so, click on Insert in the toolbar and select Chart.
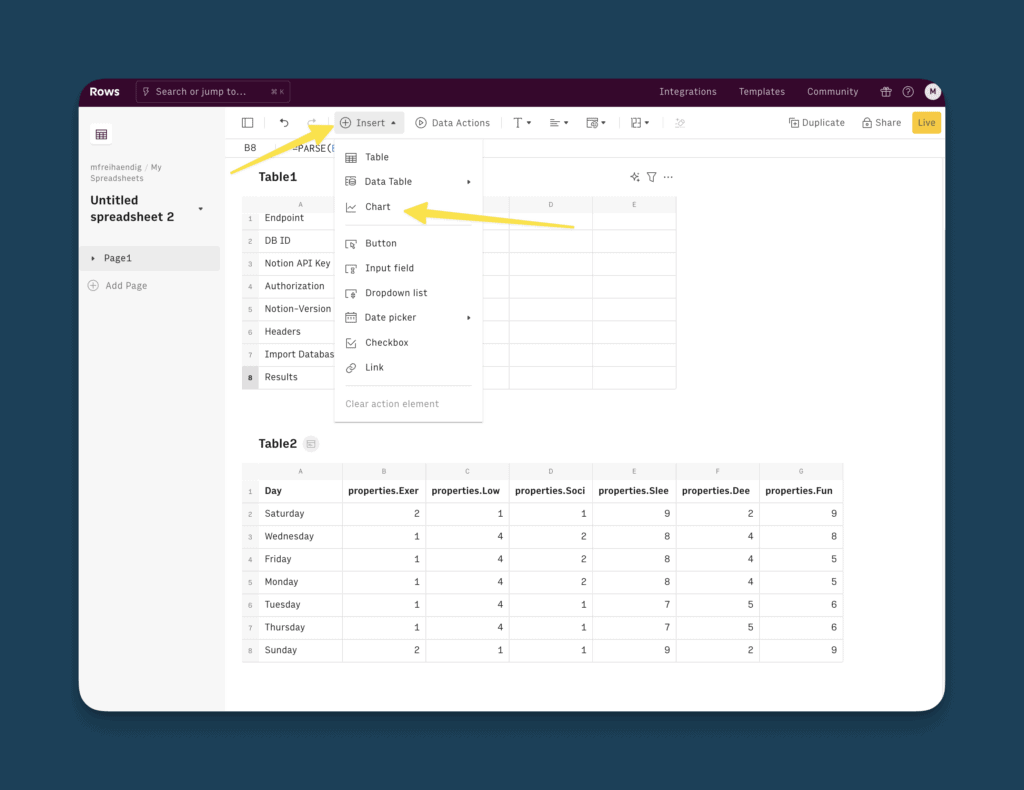
This will open up a Chart Editor in the sidebar. You can pick between a Line Chart, Column Chart, Bar Chart, Scatter Chart or Pie Chart, depending on what visualises your data best.
Then, highlight the data range with the Notion Data. Rows will automatically treat your first row as headers and the first column as data labels.
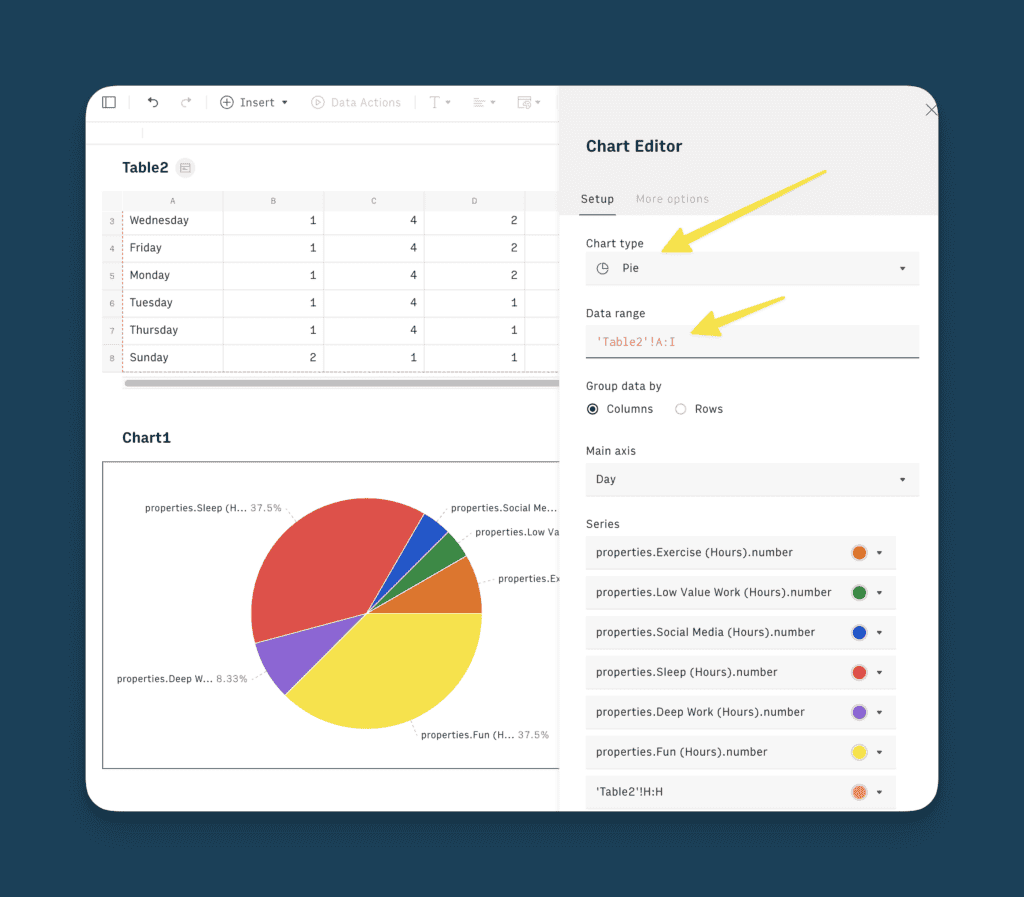
Step 4: Embed Rows Charts in Notion
Embedding your Rows Charts in Notion is easy.
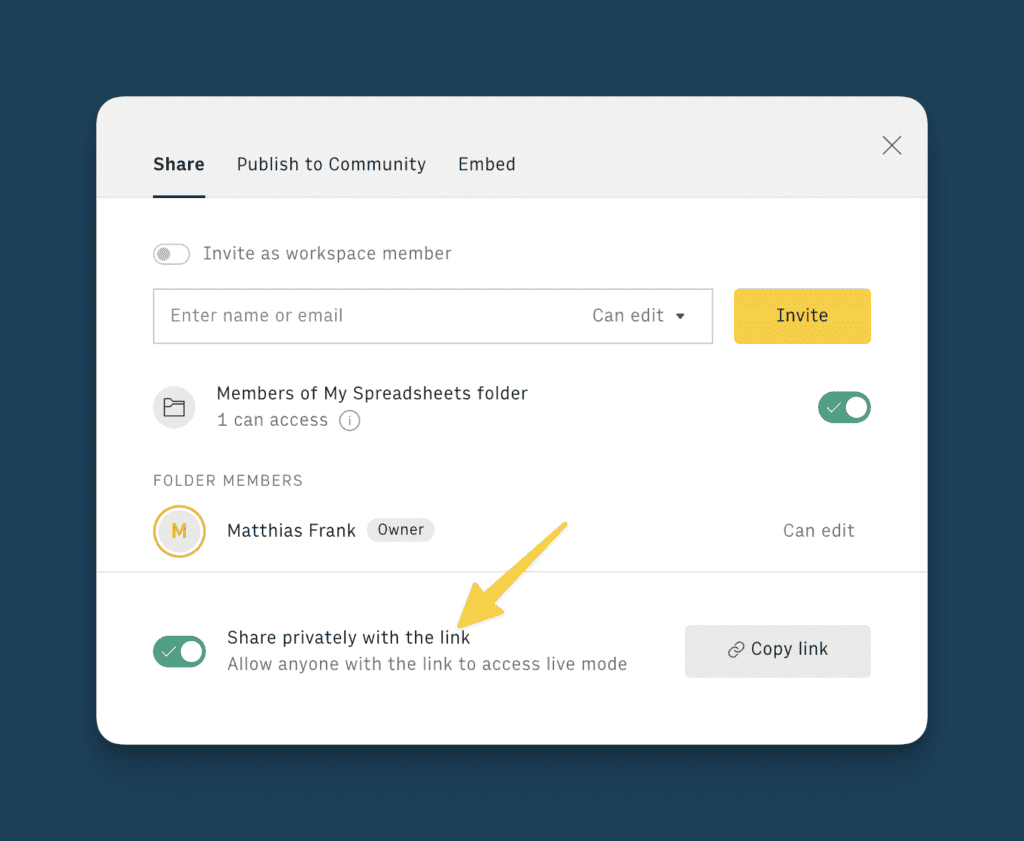
Start by clicking on the Share icon in the top right corner of your spreadsheet
Toggle on Share privately with the link
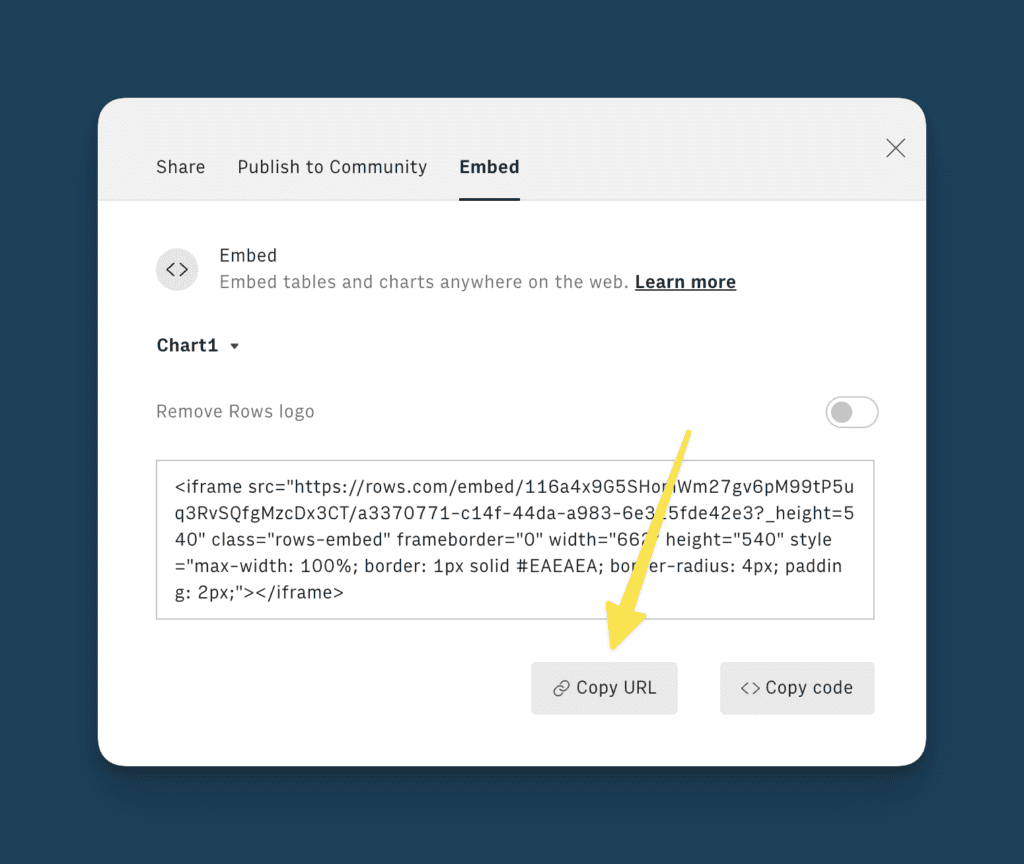
Click on the three dots in the top right corner of the chart you want to publish and opt for Embed
Click on Copy URL to copy the link to your chart
Head on over to Notion, paste your link, click on create embed and wait for your chart to load
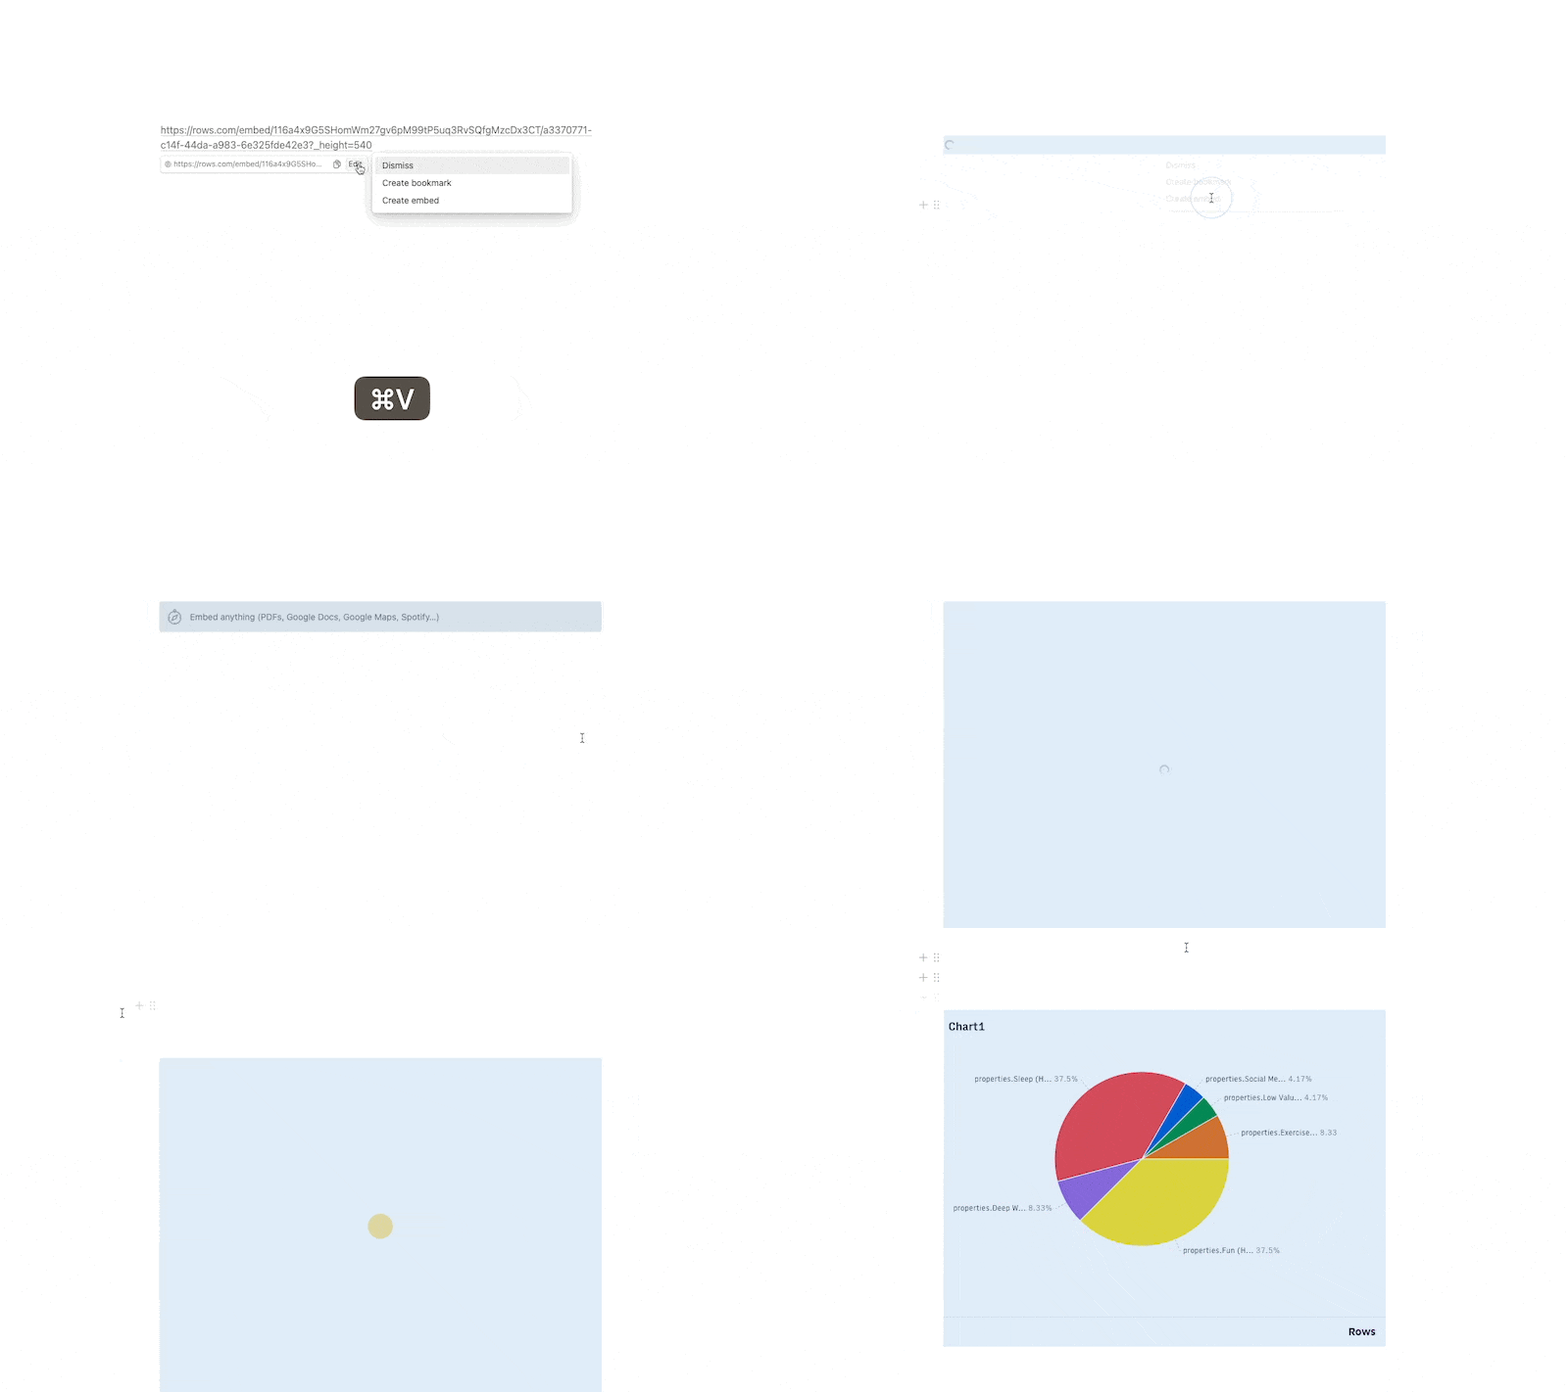
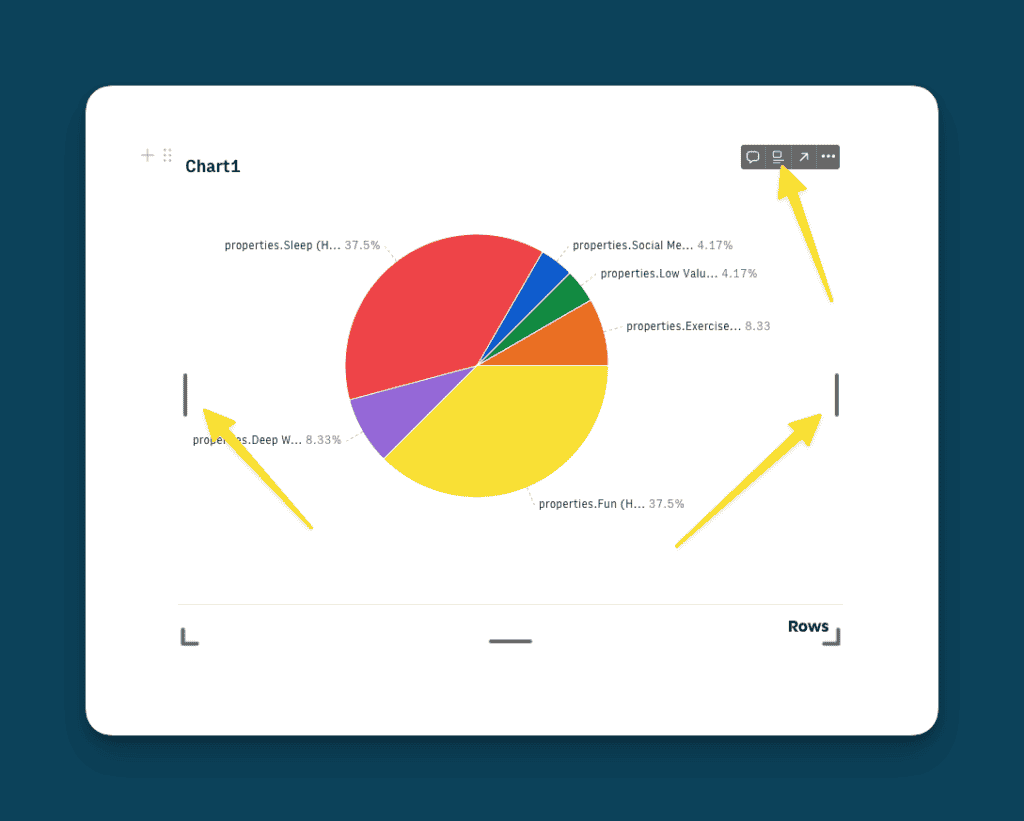
Last but not least, adjust the size of your embedding by dragging the black bars in the corners and choose your preferred alignment on the page with the icon in the context menu.
Step 5: Set up automatic data refresh in Rows
One of the big advantages of using Rows for Charts in Notion? It’s super easy to sync the data once your API connection is set up.
At any time, you can manually refresh the data by clicking into the API Call Cell (B7) and hitting enter.
To automate this process, create another row below and type Refresh into A9. Then, paste the below formula into B9:
=REFRESH(B7,30,”min”)
This will refresh your Notion Data every 30 minutes and automatically update the chart accordingly. You can swap out 30 for any time interval and “min” for any type unit to customise the refresh.
Which tools support Notion Charts?
Use these tools to create charts in Notion:
- Rows (built-in API Sync)
- Google Sheets (Sync via No-Code Tools)
- Causal (embeds only)
- Notion2Charts (built-in sync)
- Grid.is (built-in sync)
Notion Charts Frequently Asked Questions
How to make charts in Notion?
Notion doesn’t support native charts, but you can easily add charts to Notion through embeds. Simply copy a public share link to your chart and paste it into your workspace.
Does Notion have charts?
No, Notion doesn’t support charts yet. You can however use third-party tools to create charts and then embed them in Notion
Is it easy to get charts in Notion?
It’s very easy. Just create a chart in your software of choice, copy the share link and paste it into your Notion Workspace to embed the chart.
What’s the best way to get charts in Notion?
Tools like Rows or Grid.is support built-in sync with Notion and offer the most flexibility when it comes to creating charts in Notion.
Get the Notion Charts Setup Template
You can download this Notion Template plus another 21+ other free templates here:


